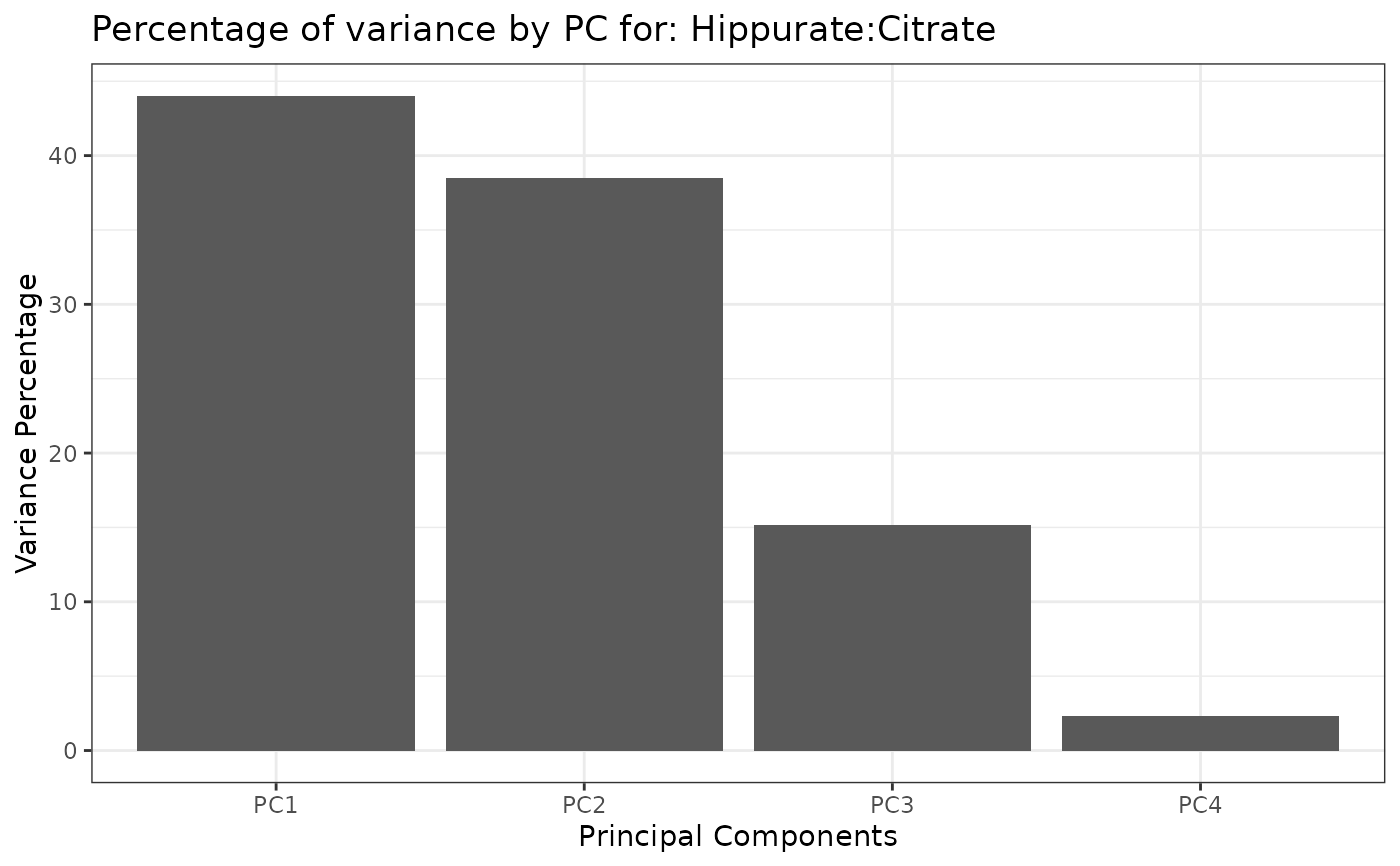
Provides a barplot of the percentage of variance associated to the PCs of the effect matrices ordered by importance based on the outputs of lmpContributions.
Arguments
- resLmpContributions
A resLmpContributions list from the function
lmpContributions.- effectNames
Names of the effects to be plotted. if
NULL, all the effects are plotted.- nPC
An integer with the number of components to plot.
- theme
ggplottheme
Examples
data("UCH")
resLmpModelMatrix <- lmpModelMatrix(UCH)
resLmpEffectMatrices <- lmpEffectMatrices(resLmpModelMatrix)
resASCAE <- lmpPcaEffects(resLmpEffectMatrices, method = "ASCA-E")
resLmpContributions <- lmpContributions(resASCAE)
lmpScreePlot(resLmpContributions, effectNames = "Hippurate:Citrate", nPC = 4)
#> $`Hippurate:Citrate`

#>
#>