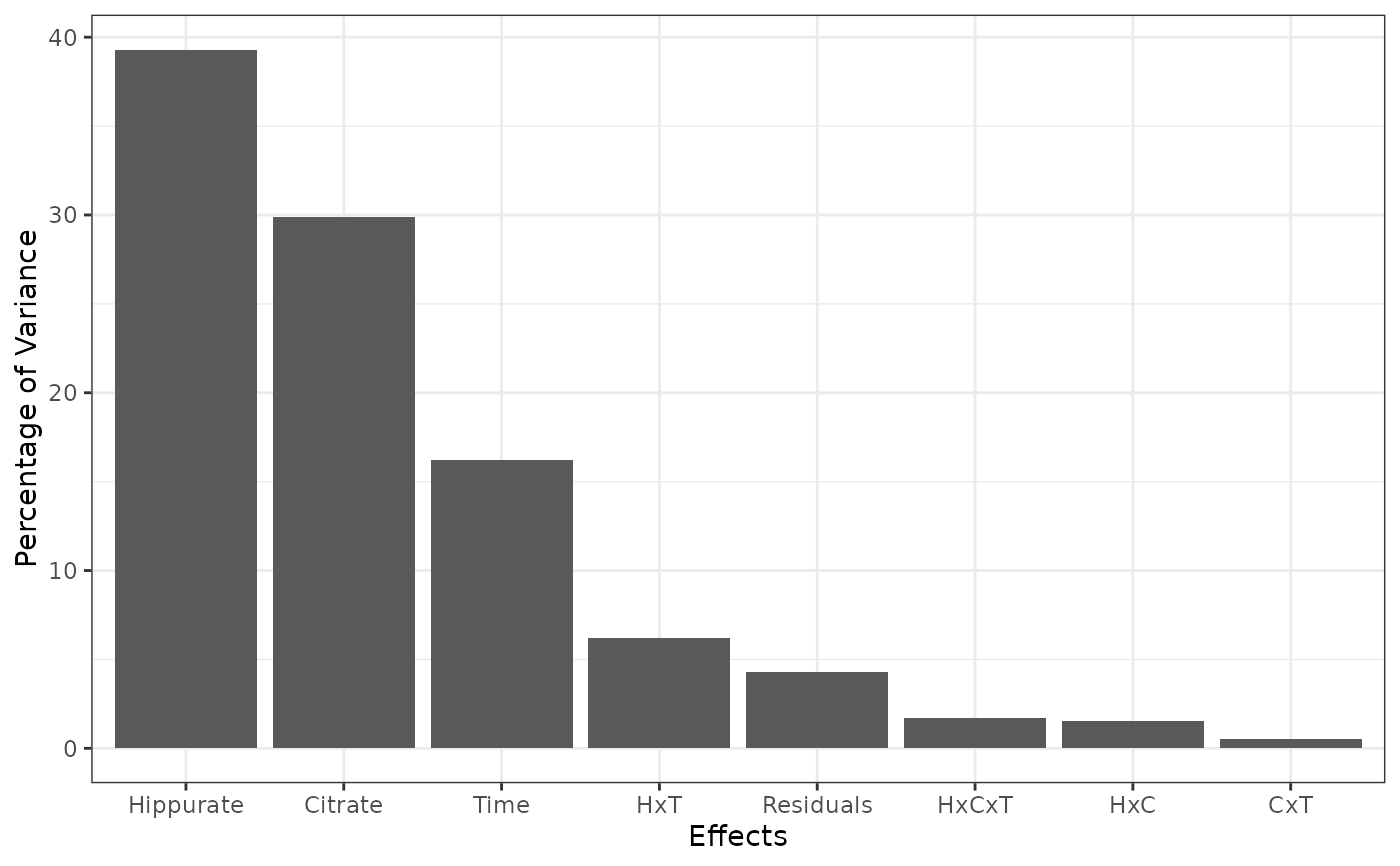
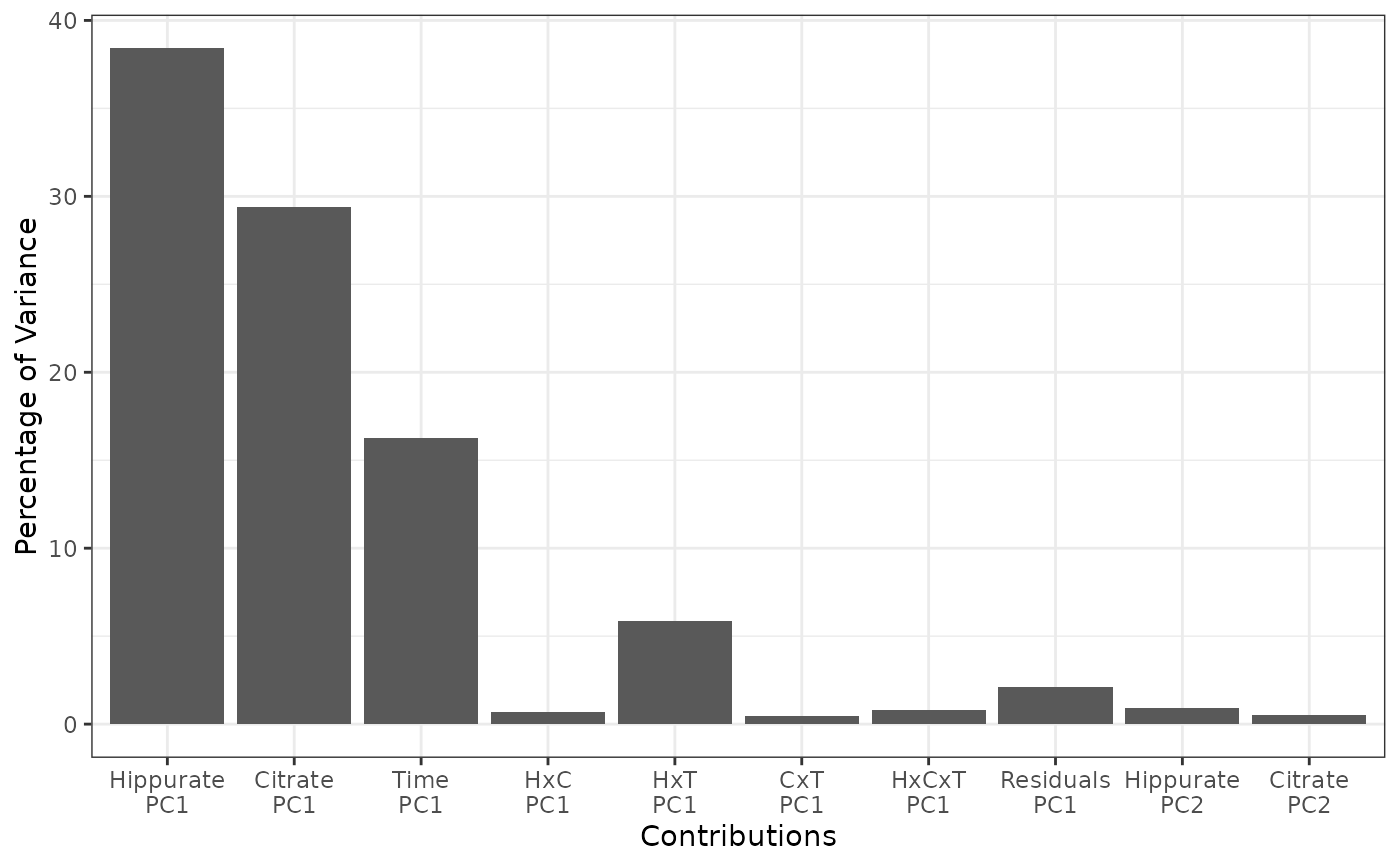
Reports the contribution of each effect to the total variance, but also the contribution of each PC to the total variance per effect. These contributions are also summarized in a barplot.
Arguments
- resLmpPcaEffects
A list corresponding to the output value of
lmpPcaEffects.- nPC
The number of Principal Components to display.
Value
A list of:
totalContribTableTable of the percentage of contribution of each effect to the total variance.
effectTableTable of the percentage of variance explained by each principal component in each model effect decomposition.
contribTableTable of the percentage of variance explained by each principal component of each effect reported to the percentage contribution of the given effect to the total variance.
combinedEffectTableEquivalent of the EffectTable for combined effects.
plotTotalPlot of the ordered contributions of TotalContribTable.
plotContribPlot of the ordered contributions of ContribTable.
Examples
data("UCH")
resLmpModelMatrix <- lmpModelMatrix(UCH)
resLmpEffectMatrices <- lmpEffectMatrices(resLmpModelMatrix)
resLmpPcaEffects <- lmpPcaEffects(resLmpEffectMatrices, method = "ASCA-E")

lmpContributions(resLmpPcaEffects)
#> $totalContribTable
#>                        Percentage of Variance
#> Hippurate                               39.31
#> Citrate                                 29.91
#> Time                                    16.24
#> Hippurate:Citrate                        1.54
#> Hippurate:Time                           6.23
#> Citrate:Time                             0.54
#> Hippurate:Citrate:Time                   1.68
#> Residuals                                4.30
#>
#> $effectTable
#>                           PC1   PC2   PC3  PC4  PC5    Sum
#> Hippurate               97.71  2.29  0.00 0.00 0.00 100.00
#> Citrate                 98.22  1.78  0.00 0.00 0.00 100.00
#> Time                   100.00  0.00  0.00 0.00 0.00 100.00
#> Hippurate:Citrate       44.01 38.51 15.13 2.34 0.00  99.99
#> Hippurate:Time          93.92  6.08  0.00 0.00 0.00 100.00
#> Citrate:Time            90.76  9.24  0.00 0.00 0.00 100.00
#> Hippurate:Citrate:Time  47.23 27.49 22.60 2.68 0.00 100.00
#> Residuals               48.54 16.90 10.28 5.93 4.32  85.97
#>
#> $contribTable
#>                          PC1  PC2  PC3  PC4  PC5 Contrib
#> Hippurate              38.41 0.90 0.00 0.00 0.00   39.31
#> Citrate                29.37 0.53 0.00 0.00 0.00   29.91
#> Time                   16.24 0.00 0.00 0.00 0.00   16.24
#> Hippurate:Citrate       0.68 0.59 0.23 0.04 0.00    1.54
#> Hippurate:Time          5.85 0.38 0.00 0.00 0.00    6.23
#> Citrate:Time            0.49 0.05 0.00 0.00 0.00    0.54
#> Hippurate:Citrate:Time  0.80 0.46 0.38 0.05 0.00    1.68
#> Residuals               2.09 0.73 0.44 0.25 0.19    4.30
#>
#> $combinedEffectTable
#>             PC1  PC2   PC3  PC4  PC5   Sum
#> Residuals 48.54 16.9 10.28 5.93 4.32 85.97
#>
#> $plotTotal

#>
#> $plotContrib

#>
#> $plotContrib
 #>
#>