Draws the score plots of each (augmented) effect matrix provided in lmpPcaEffects. As a wrapper of the plotScatter function, it allows to visualize the scores of the effect matrices for two components at a time with all the available options in plotScatter.
Usage
lmpScorePlot(resLmpPcaEffects, effectNames = NULL, axes = c(1, 2), ...)Arguments
- resLmpPcaEffects
A list corresponding to the output value of
lmpPcaEffects.- effectNames
Names of the effects to be plotted. If
NULL, all the effects are plotted.- axes
A numerical vector with the 2 Principal Components axes to be drawn.
- ...
Additional arguments to be passed to
plotScatter.
Details
lmpScorePlot is a wrapper of plotScatter.
Examples
data("UCH")
resLmpModelMatrix <- lmpModelMatrix(UCH)
resLmpEffectMatrices <- lmpEffectMatrices(resLmpModelMatrix)
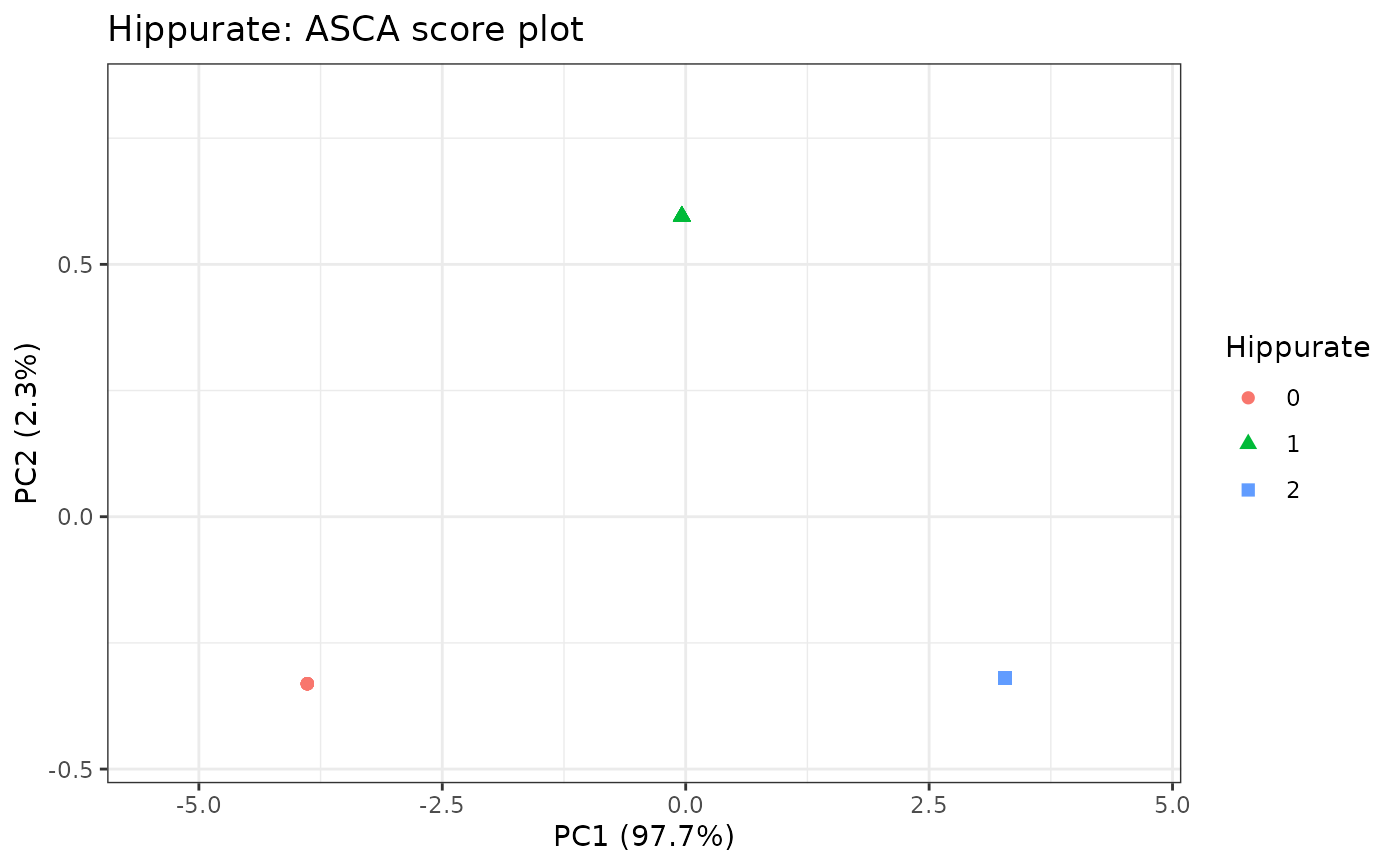
# PCA decomposition of effect matrices (ASCA)
resASCA <- lmpPcaEffects(resLmpEffectMatrices)
# Score plot of Hippurate effect matrix
lmpScorePlot(resASCA,
effectNames = "Hippurate",
color = "Hippurate", shape = "Hippurate"
)
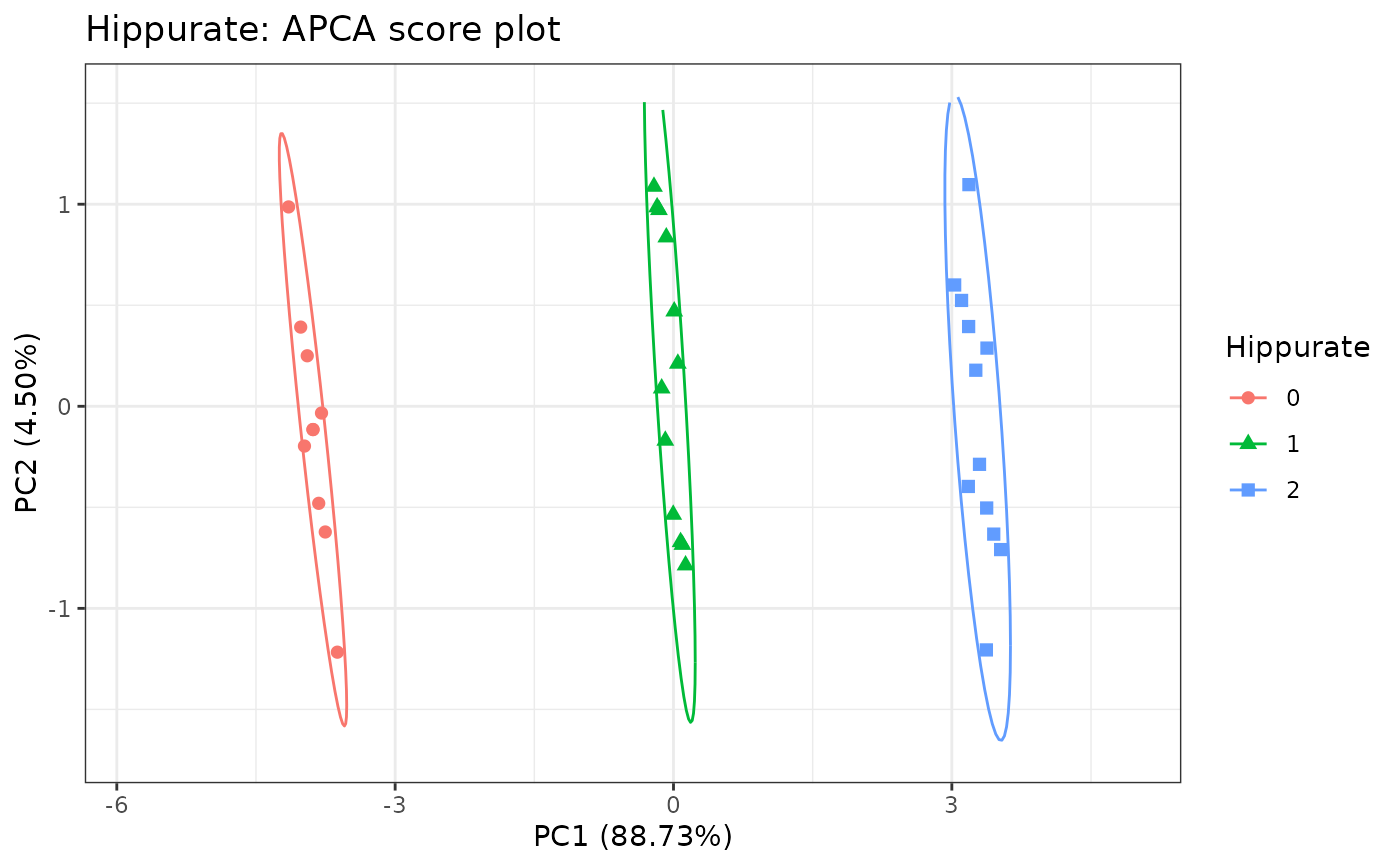
 # PCA decomposition of augmented effect matrices (APCA)
resASCA <- lmpPcaEffects(resLmpEffectMatrices, method = "APCA")
# Score plot of Hippurate augmented effect matrix
lmpScorePlot(resASCA,
effectNames = "Hippurate",
color = "Hippurate", shape = "Hippurate", drawShapes = "ellipse"
)
# PCA decomposition of augmented effect matrices (APCA)
resASCA <- lmpPcaEffects(resLmpEffectMatrices, method = "APCA")
# Score plot of Hippurate augmented effect matrix
lmpScorePlot(resASCA,
effectNames = "Hippurate",
color = "Hippurate", shape = "Hippurate", drawShapes = "ellipse"
)