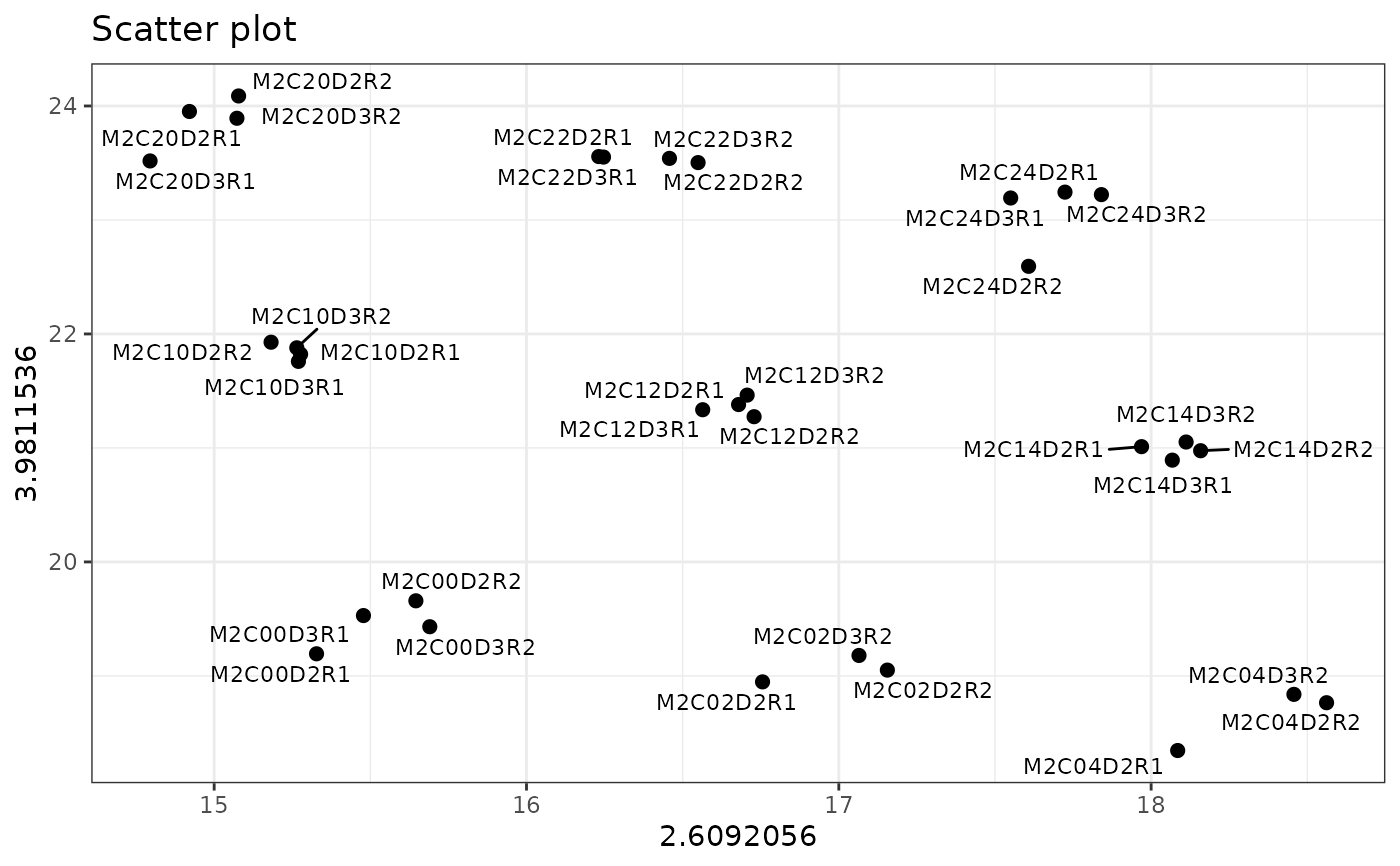
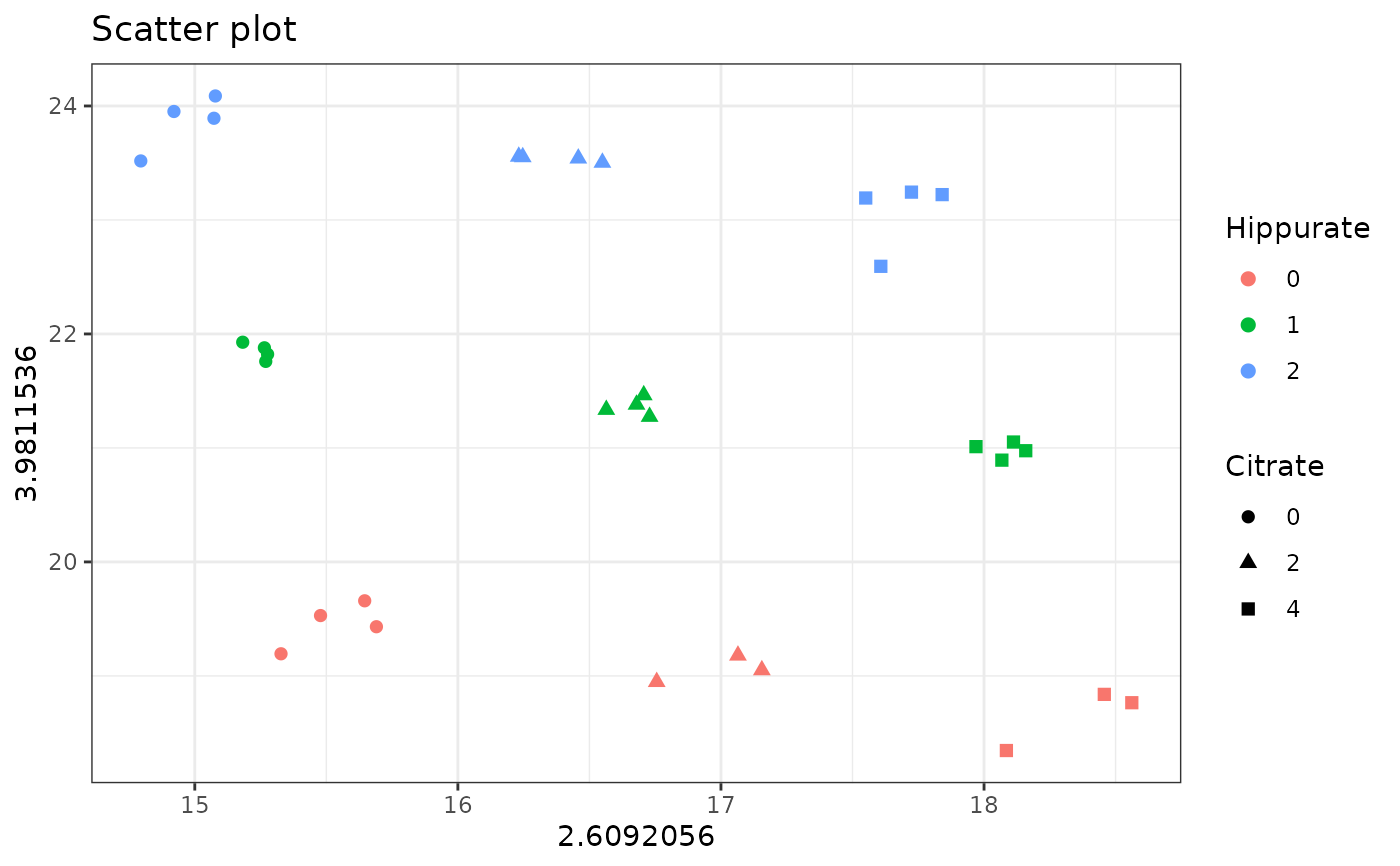
Produces a plot describing the relationship between two columns of the outcomes matrix \(Y\). Colors and symbols can be chosen for the levels of the design factors. Ellipses, polygons or segments can be added to group different sets of points on the graph.
Usage
plotScatter(
  Y = NULL,
  design = NULL,
  lmpDataList = NULL,
  xy,
  color = NULL,
  shape = NULL,
  points_labs = NULL,
  title = "Scatter plot",
  xlab = NULL,
  ylab = NULL,
  size = 2,
  size_lab = 3,
  drawShapes = c("none", "ellipse", "polygon", "segment"),
  typeEl = c("norm", "t", "euclid"),
  levelEl = 0.9,
  alphaPoly = 0.4,
  theme = theme_bw(),
  drawOrigin = FALSE
)
Arguments
- Y
A \(n \times m\) matrix with \(n\) observations and \(m\) variables. Can be
NULLiflmpDataListis defined.- design
A \(n \times k\) "freely encoded" experimental design data.frame. Can be
NULLiflmpDataListis defined.- lmpDataList
If not
NULL, a list with outcomes, design and formula, as outputted bydata2LmpDataList.- xy
x- and y-axis values: a vector of length 2 with either the column name(s) of the \(Y\) matrix to plot (character) or the index position(s) (integer).
- color
If not
NULL, a character string giving the column name ofdesignto be used as color. Currently treated as a discrete variable.- shape
If not
NULL, a character string giving the column name ofdesignto be used as shape. Currently treated as a discrete variable.- points_labs
If not
NULL, a character vector with point labels.- title
Plot title.
- xlab
If not
NULL, label for the x-axis.- ylab
If not
NULL, label for the y-axis.- size
The points size, by default
2.- size_lab
The size of points labels, by default
3.- drawShapes
Multiple shapes can be drawn based on the
color:"none"for no shape (default),"ellipse"(ellipses withggplot2::stat_ellipse()),"polygon"(polygons withggplot2::geom_polygon()) or"segment"(segment from the centroids withggplot2::geom_segment()).- typeEl
The type of ellipse, either
"norm"(multivariate normal distribution, the default),"t"(multivariate t-distribution) or"euclid"(draws a circle with the radius equal to level, representing the euclidean distance from the center).- levelEl
The confidence level at which to draw an ellipse, by default
0.9.- alphaPoly
The degree of transparency for polygons, by default
0.4.- theme
The
ggplot2theme (default:theme_bw()), see?ggthemefor more info.- drawOrigin
If
TRUE, draws horizontal and vertical intercepts at (0,0).
Details
Either Y or lmpDataList need to be defined. If both are given, the priority goes to Y.
The same rule applies for design or lmpDataList.
Examples
data("UCH")
# Without the design info
plotScatter(Y = UCH$outcomes, xy = c(453, 369))
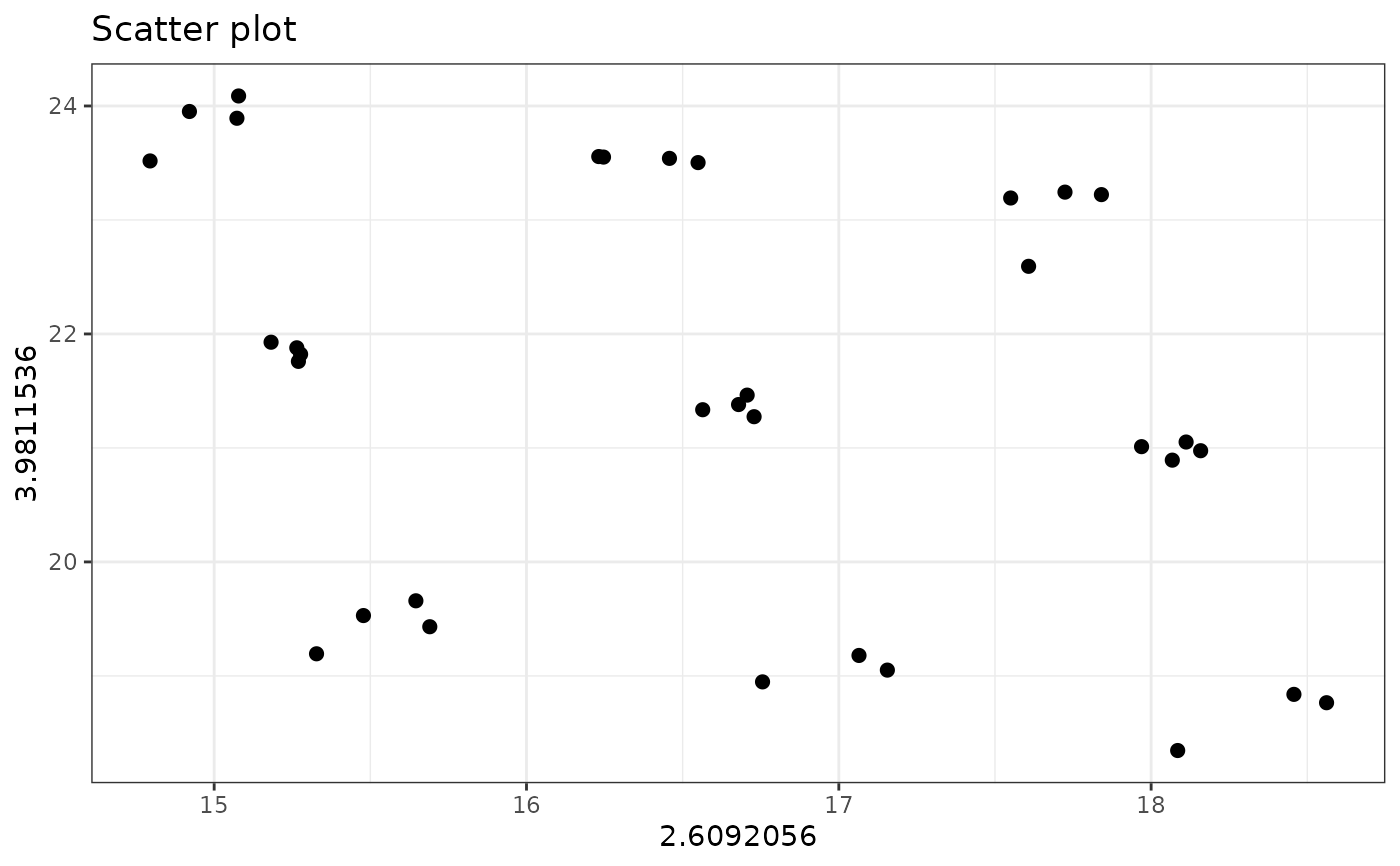
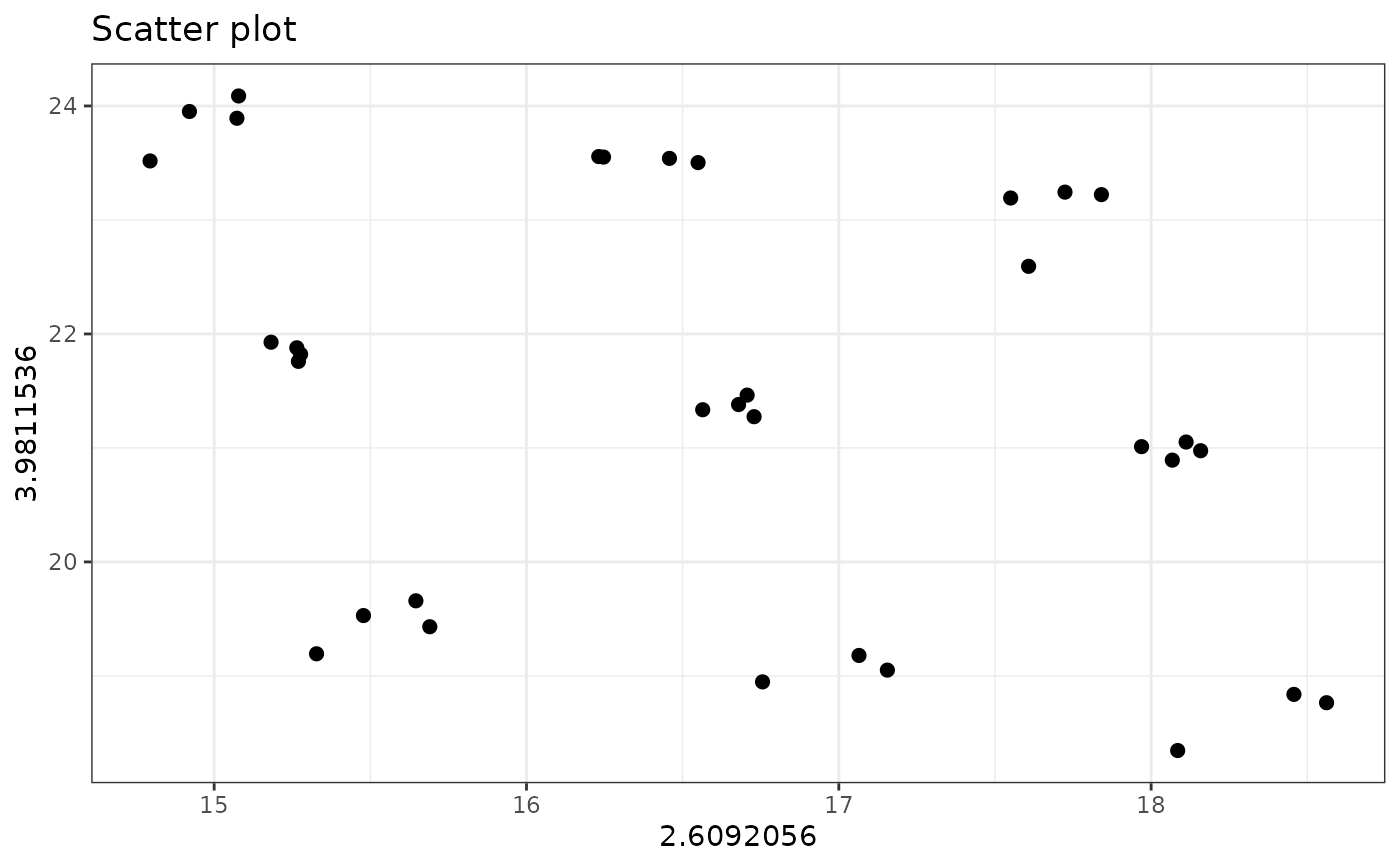 # equivalent to:
plotScatter(lmpDataList = UCH, xy = c(453, 369))
 # With color and shape
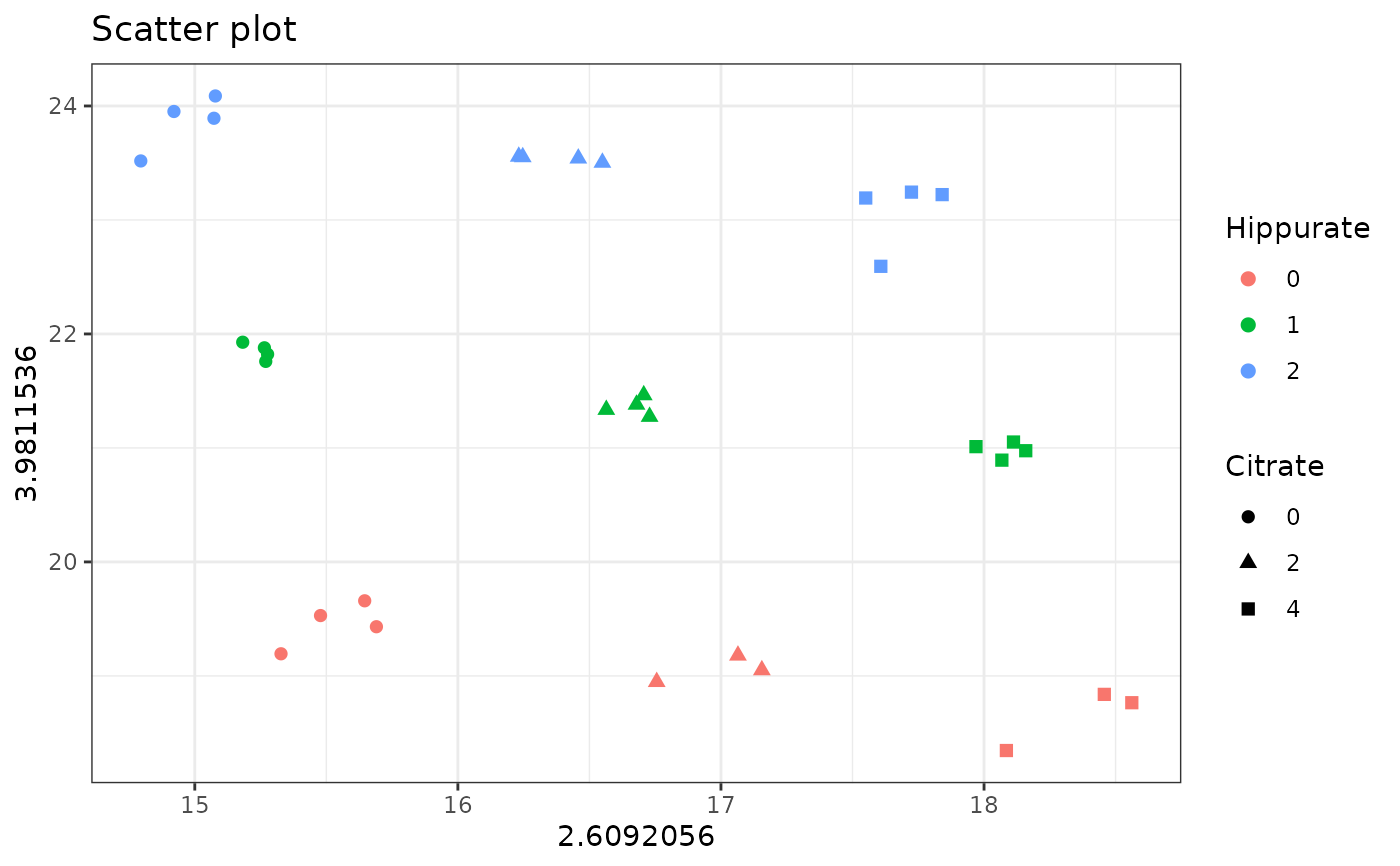
plotScatter(
lmpDataList = UCH,
xy = c(453, 369), color = "Hippurate",
shape = "Citrate"
)
 # equivalent to:
plotScatter(
Y = UCH$outcomes, design = UCH$design,
xy = c(453, 369), color = "Hippurate",
shape = "Citrate"
)
 # With color and shapes
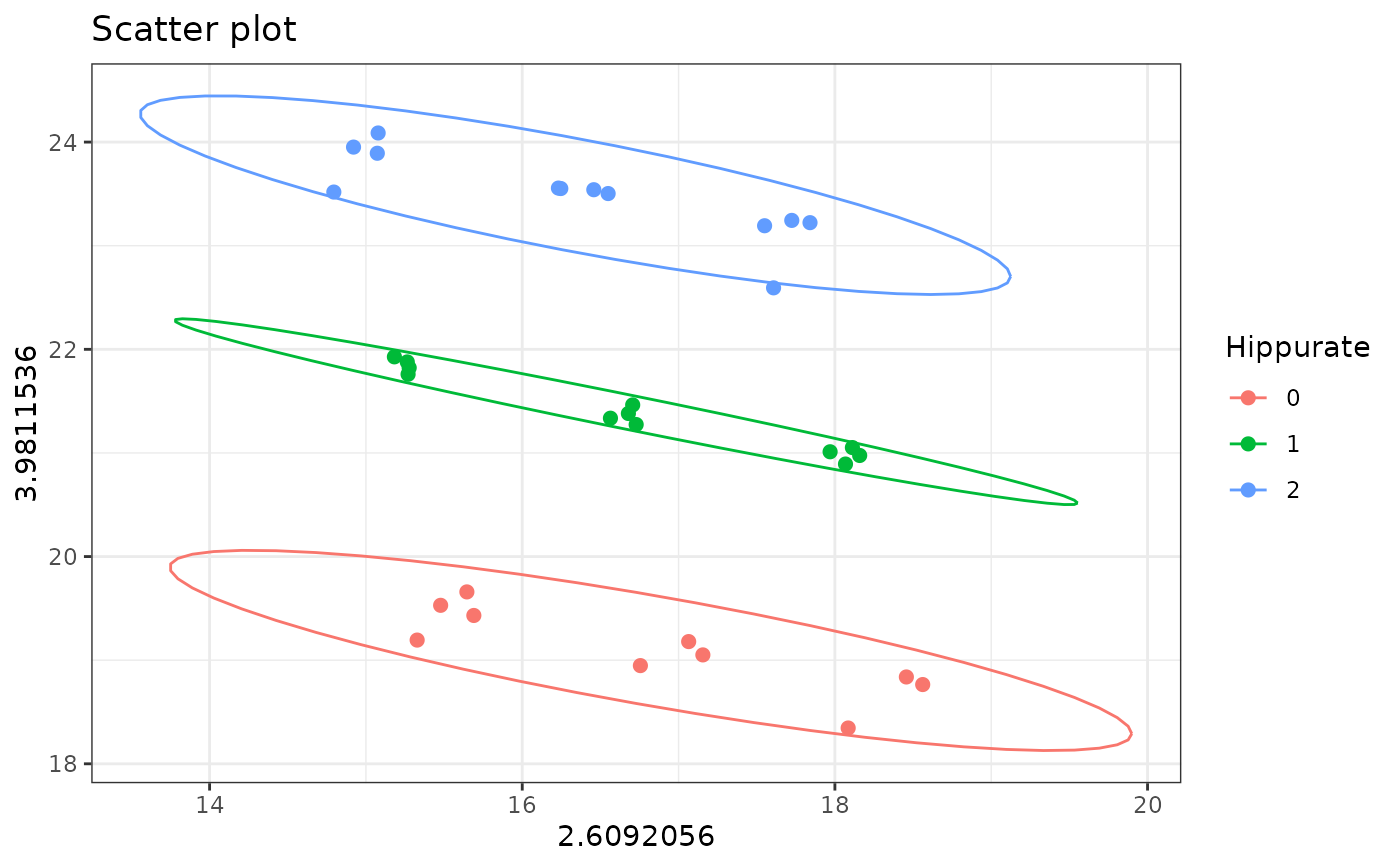
plotScatter(
Y = UCH$outcomes, design = UCH$design,
xy = c(453, 369), color = "Hippurate",
drawShapes = "ellipse"
)
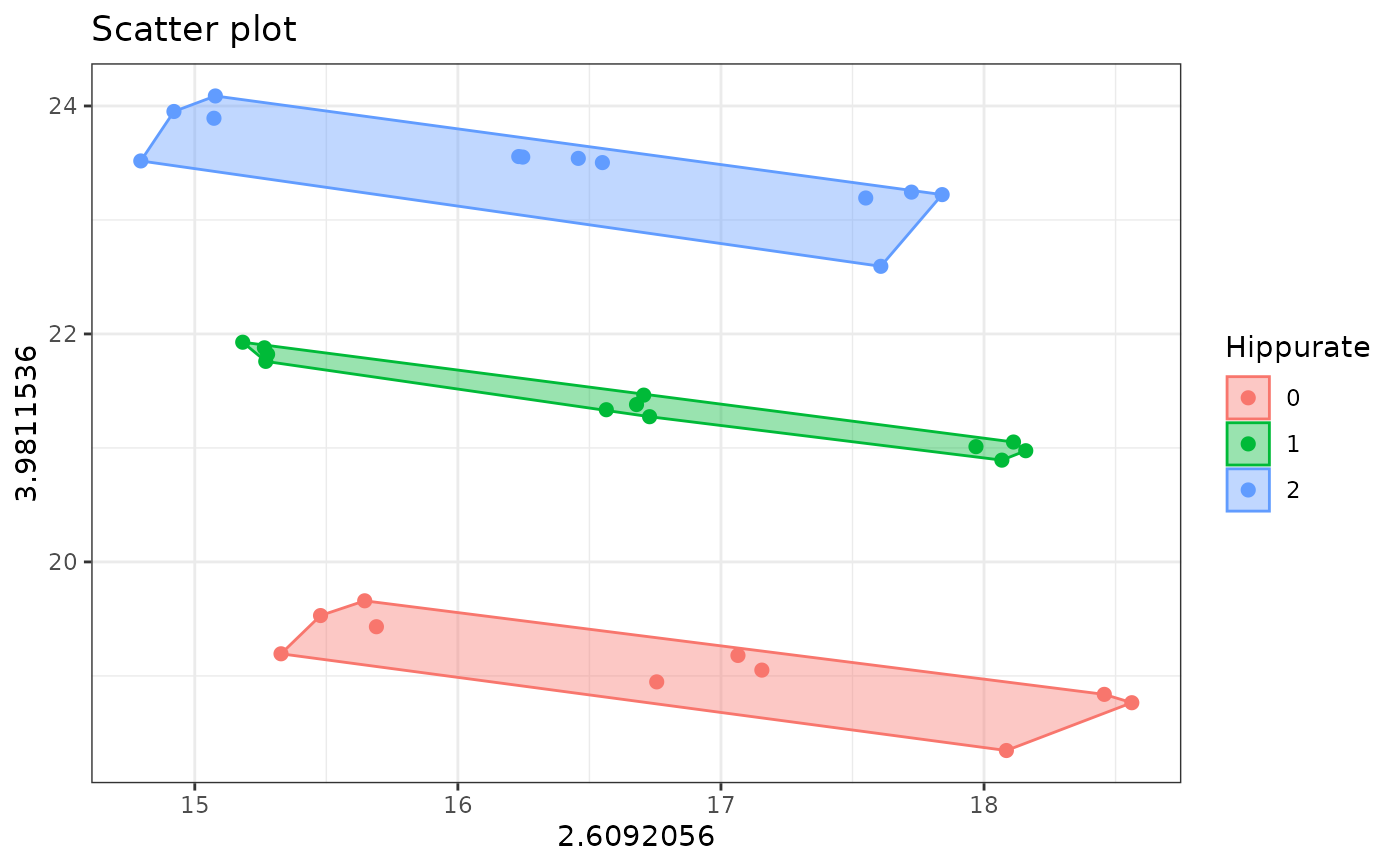
 plotScatter(
Y = UCH$outcomes, design = UCH$design,
xy = c(453, 369), color = "Hippurate",
drawShapes = "polygon"
)
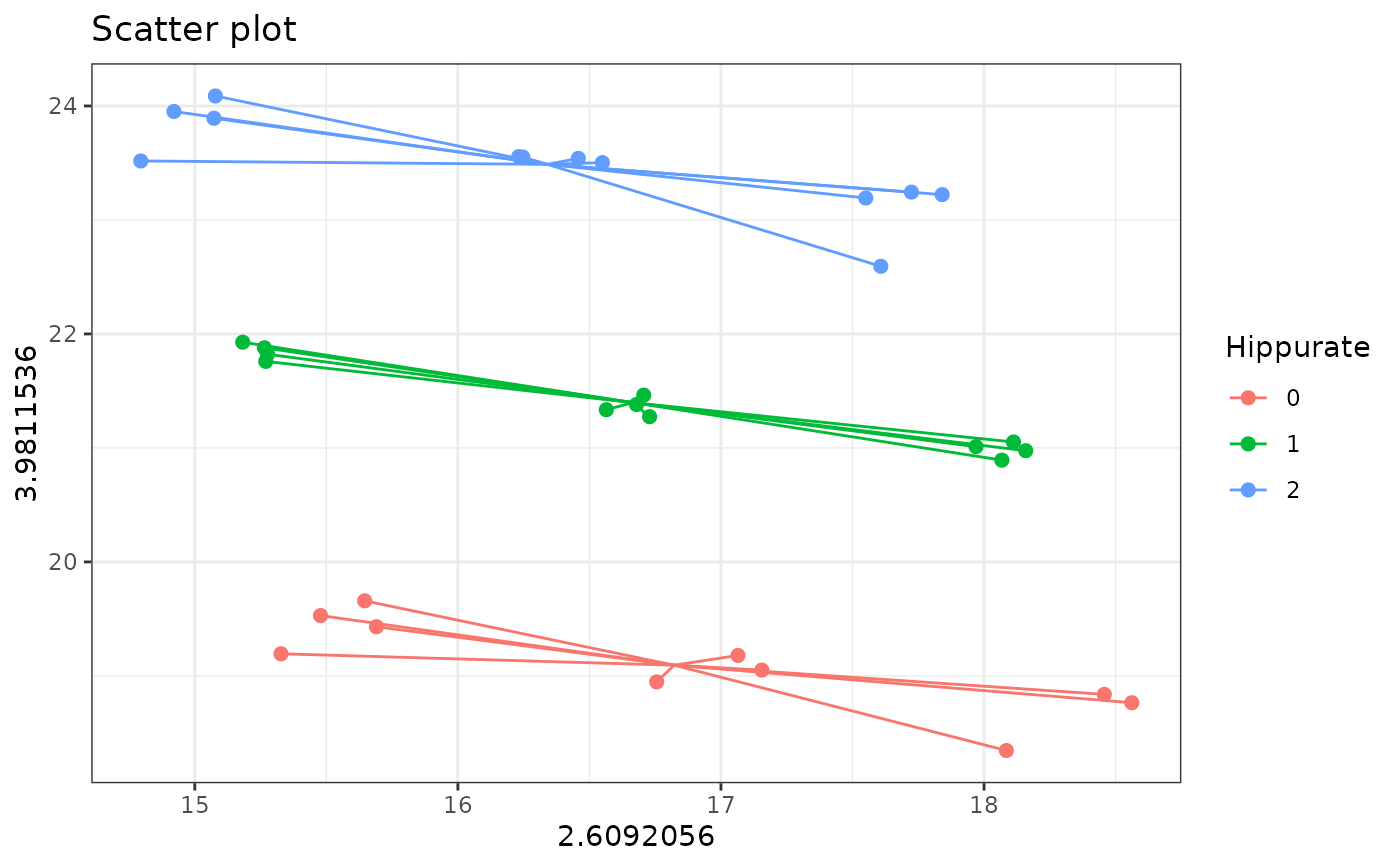
 plotScatter(
Y = UCH$outcomes, design = UCH$design,
xy = c(453, 369), color = "Hippurate",
drawShapes = "segment"
)
 # With customized shapes
library(ggplot2)
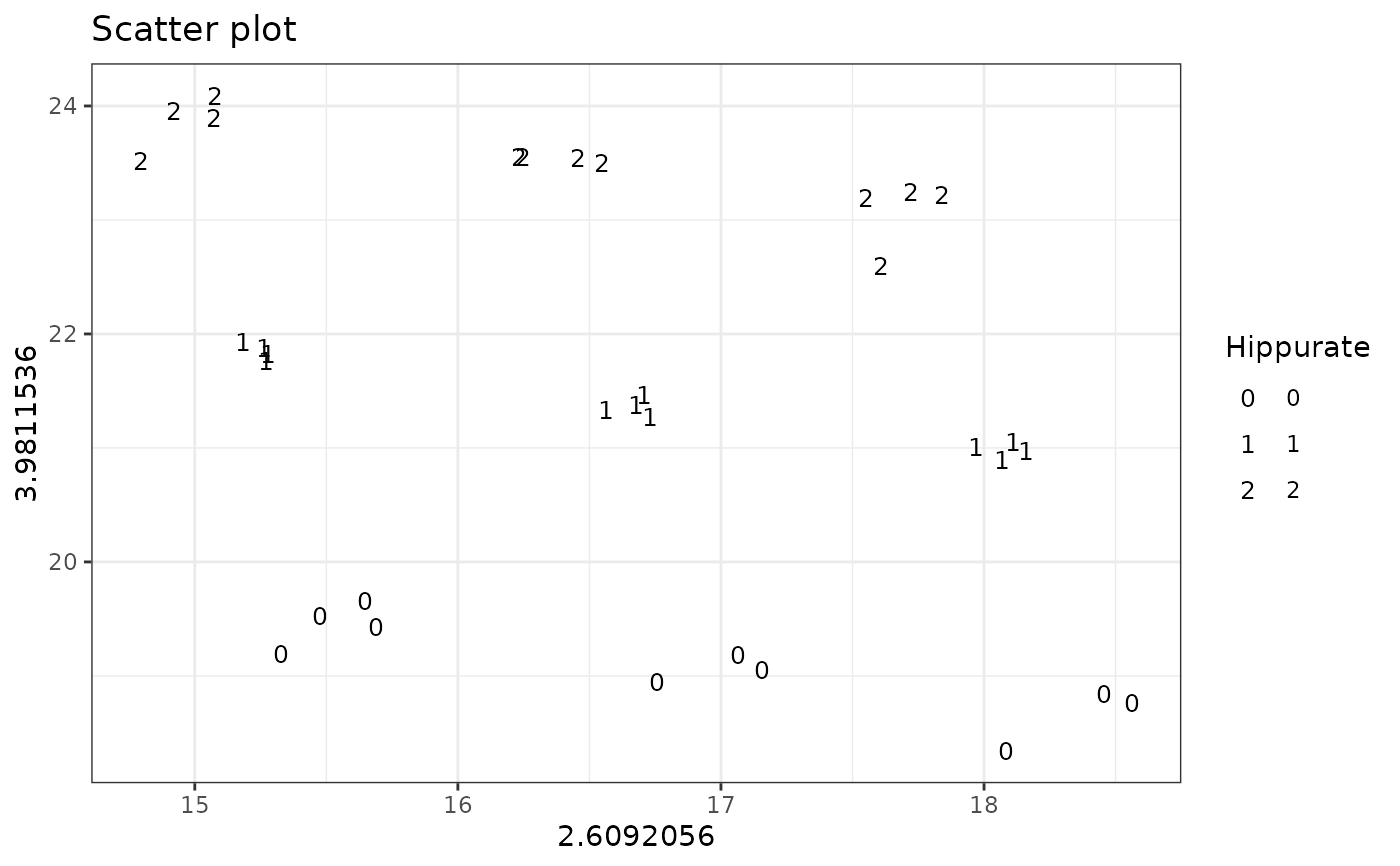
plotScatter(
Y = UCH$outcomes, design = UCH$design,
xy = c(453, 369), shape = "Hippurate", size = 3
) +
scale_discrete_identity(
aesthetics = "shape",
guide = "legend"
)
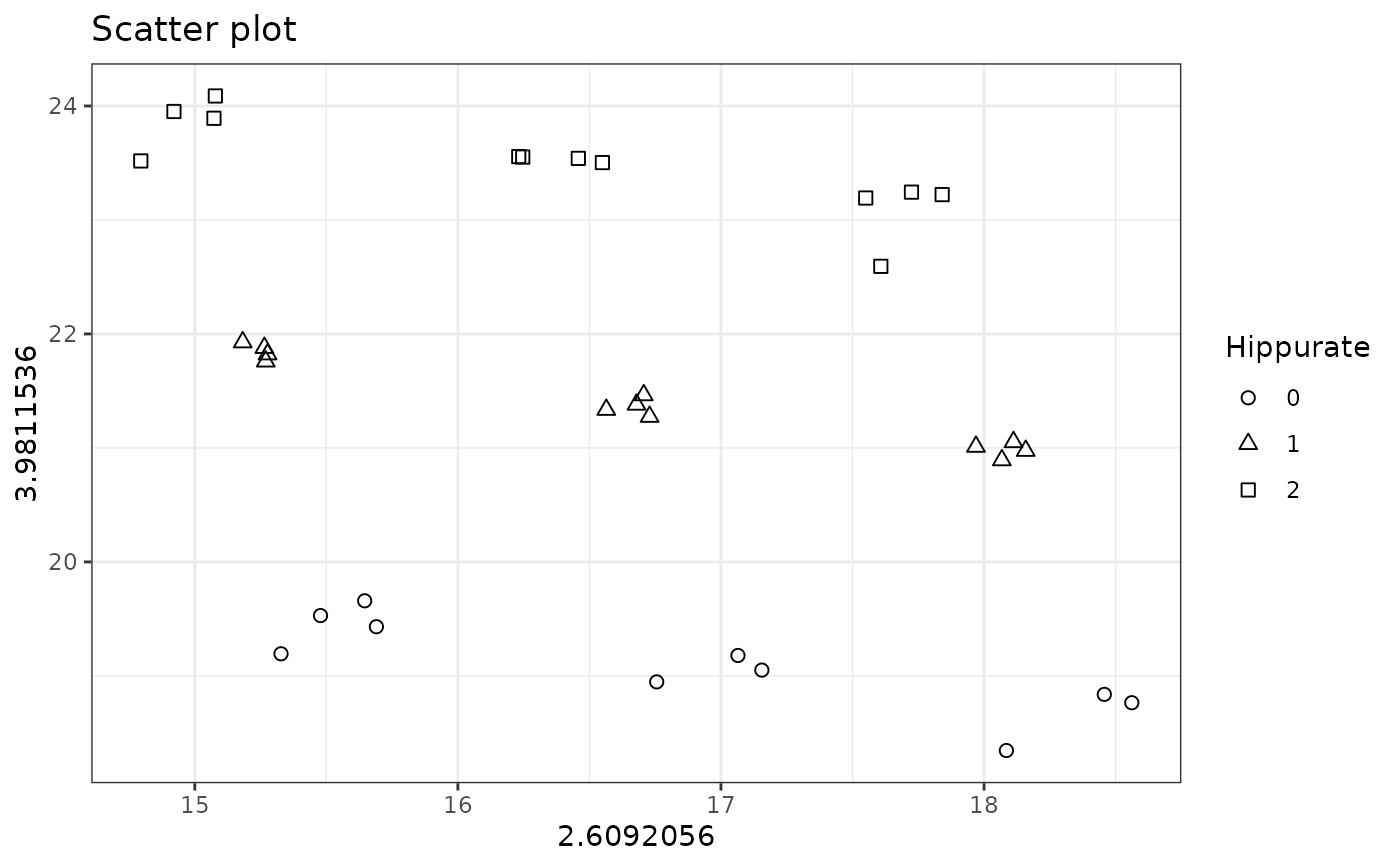
 plotScatter(
Y = UCH$outcomes, design = UCH$design,
xy = c(453, 369), shape = "Hippurate"
) +
scale_shape_discrete(solid = FALSE)
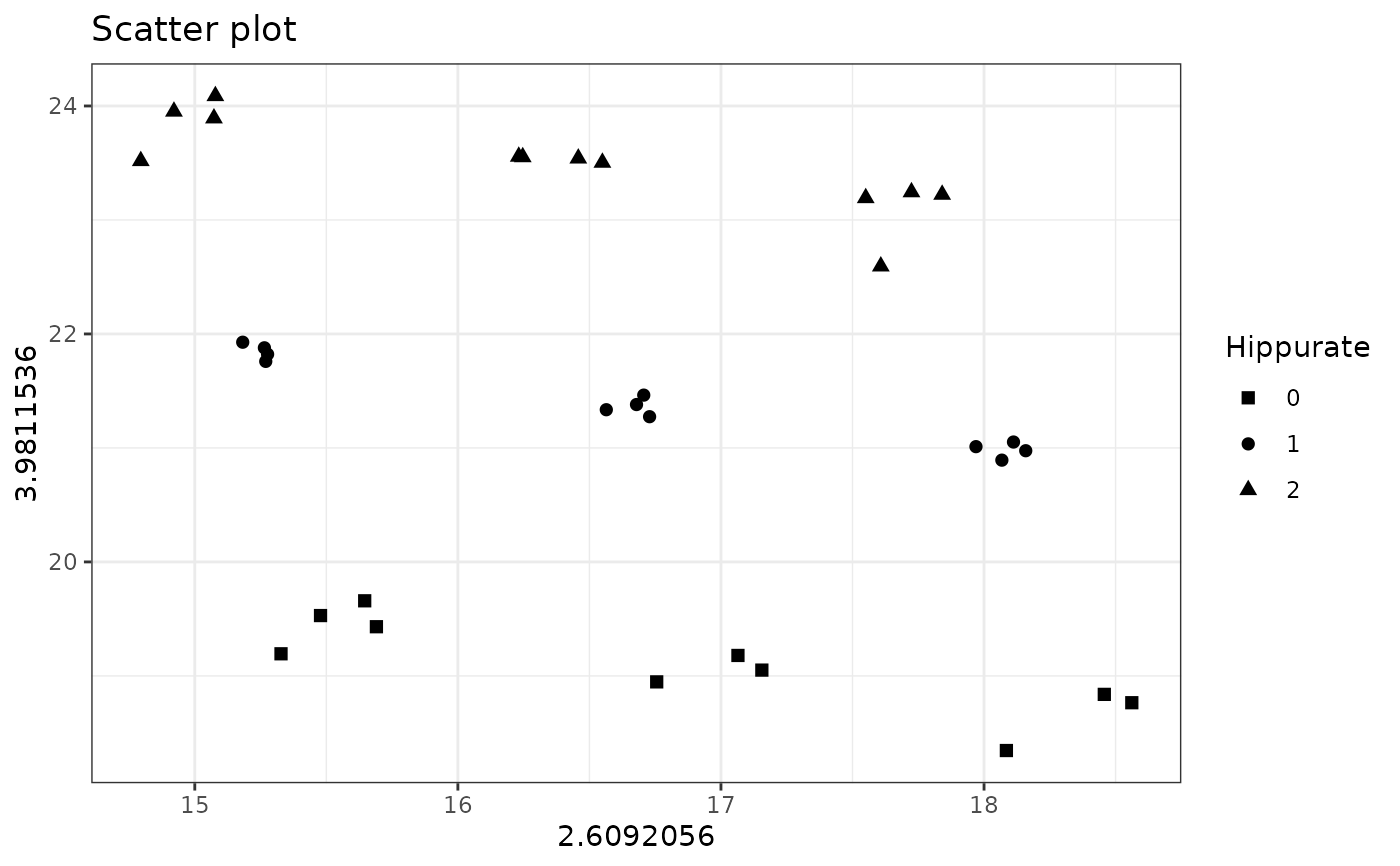
 plotScatter(
Y = UCH$outcomes, design = UCH$design,
xy = c(453, 369), shape = "Hippurate"
) +
scale_shape_manual(values = c(15, 16, 17))
 # With labels
plotScatter(
Y = UCH$outcomes, design = UCH$design,
xy = c(453, 369), points_labs = rownames(UCH$design)
)
