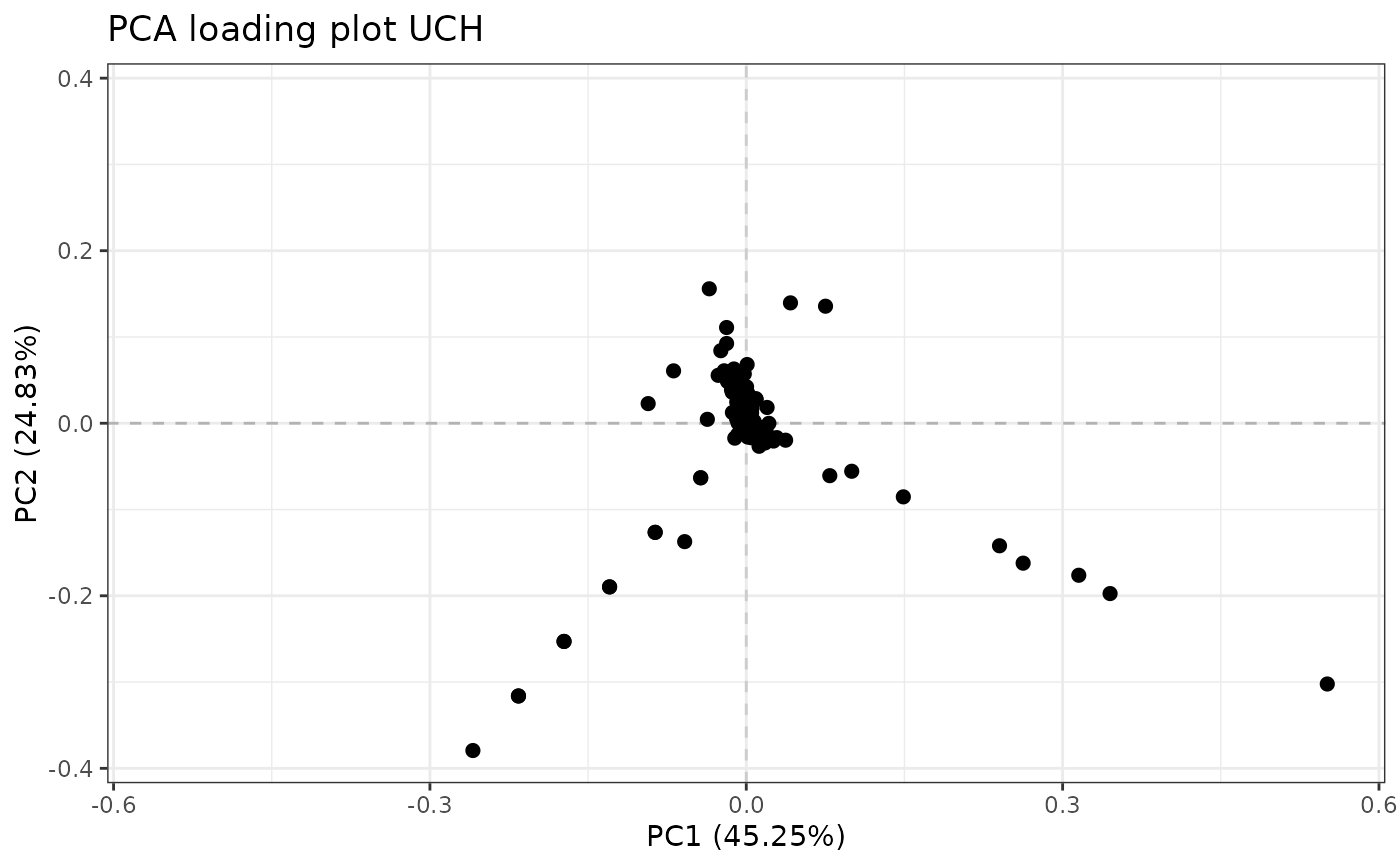
Produces 2D loading plots from pcaBySvd with the same graphical options as plotScatter as this is a wrapper of this function.
Usage
pcaLoading2dPlot(
  resPcaBySvd,
  axes = c(1, 2),
  title = "PCA loading plot",
  addRownames = FALSE,
  pl_n = 10,
  metadata = NULL,
  drawOrigin = TRUE,
  ...
)
Arguments
- resPcaBySvd
A list corresponding to the output value of
pcaBySvd.- axes
A numerical vector of length 2 with the Principal Components axes to be drawn.
- title
Plot title.
- addRownames
Boolean indicating if the labels should be plotted. By default, uses the row names of the loadings matrix but it can be manually specified with the
points_labsargument fromplotScatter.- pl_n
The number of labels that should be plotted, based on a distance measure (see Details).
- metadata
A \(n \times k\) "freely encoded" data.frame corresponding to the
designargument inplotScatter.- drawOrigin
if
TRUE, draws horizontal and vertical intercepts at (0,0) based on theplotScatterfunction.- ...
Additional arguments to be passed to
plotScatter.
Details
pcaLoading2dPlot is a wrapper of plotScatter. See ?plotScatter for more information on the additional arguments.
The distance measure \(d\) that is used to rank the variables is based on the following formula: $$d = \sqrt(P_{ab}^2*\lambda_{ab}^2)$$ where \(a\) and \(b\) are two selected Principal Components, \(P_{ab}\) represents their loadings and \(\lambda_{ab}\) their singular values.
Examples
data("UCH")
ResPCA <- pcaBySvd(UCH$outcomes)

pcaLoading2dPlot(
  resPcaBySvd = ResPCA, axes = c(1, 2),
  title = "PCA loading plot UCH"
)


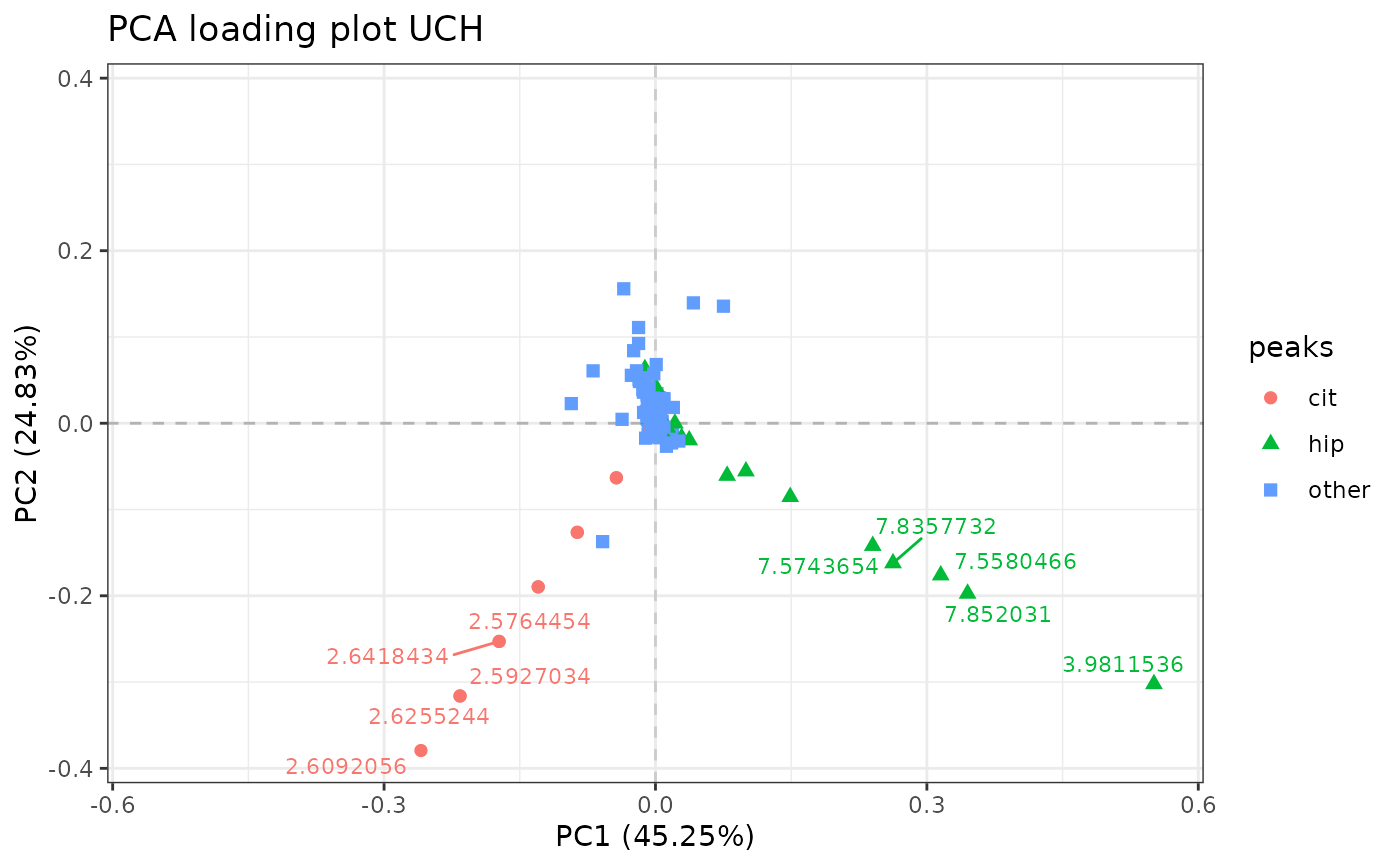
# adding color,  shape and labels to points
id_cit <- seq(446, 459)
id_hip <- c(seq(126, 156), seq(362, 375))
peaks <- rep("other", ncol(UCH$outcomes))
peaks[id_hip] <- "hip"
peaks[id_cit] <- "cit"
metadata <- data.frame(peaks)

pcaLoading2dPlot(
  resPcaBySvd = ResPCA, axes = c(1, 2),
  title = "PCA loading plot UCH", metadata = metadata,
  color = "peaks", shape = "peaks", addRownames = TRUE
)
#> Warning: at least one variable used as color or shape is not a factor and will be converted as such


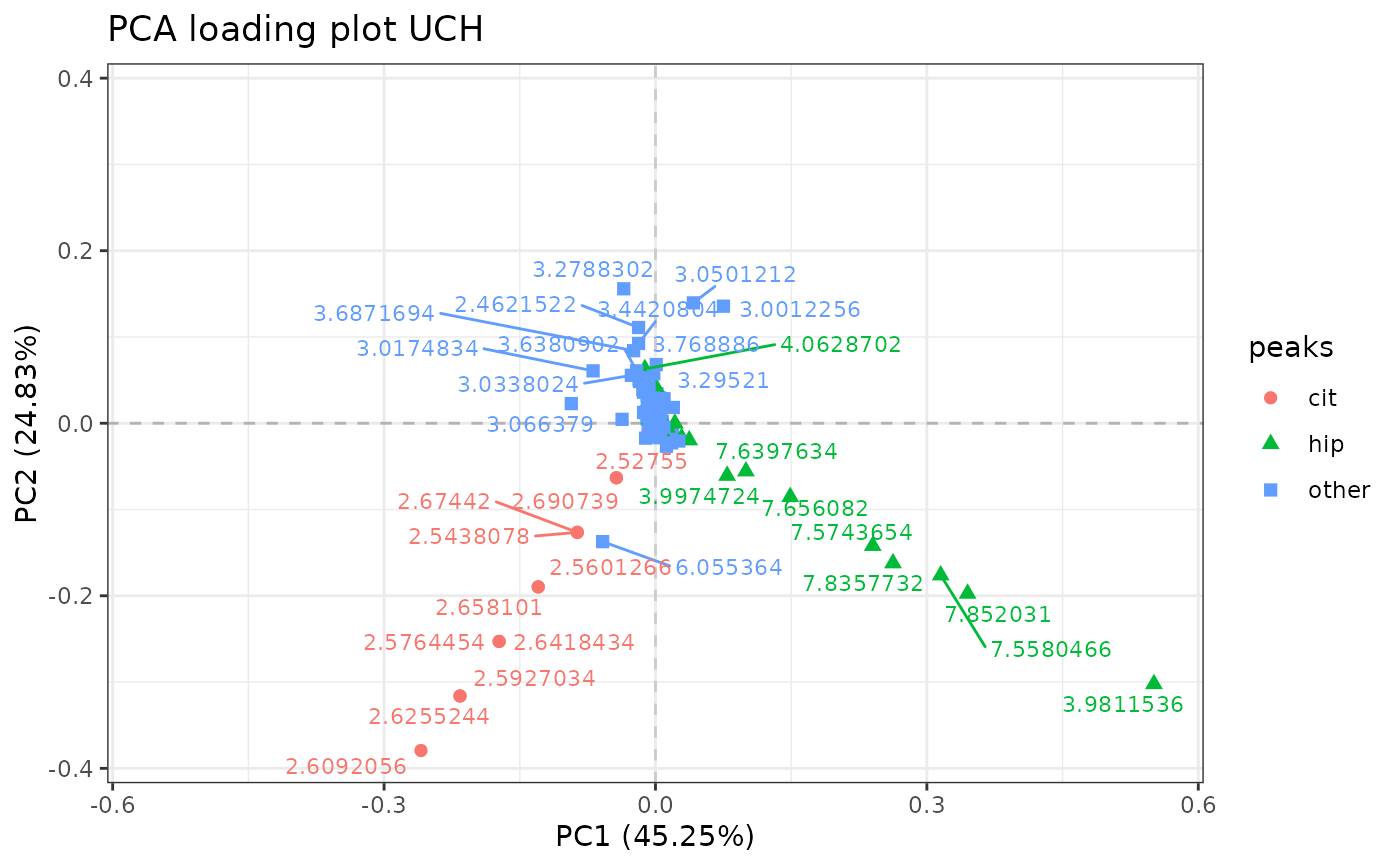
# changing max.overlaps of ggrepel
options(ggrepel.max.overlaps = 30)
pcaLoading2dPlot(
  resPcaBySvd = ResPCA, axes = c(1, 2),
  title = "PCA loading plot UCH", metadata = metadata,
  color = "peaks", shape = "peaks", addRownames = TRUE,
  pl_n = 35
)
#> Warning: at least one variable used as color or shape is not a factor and will be converted as such
