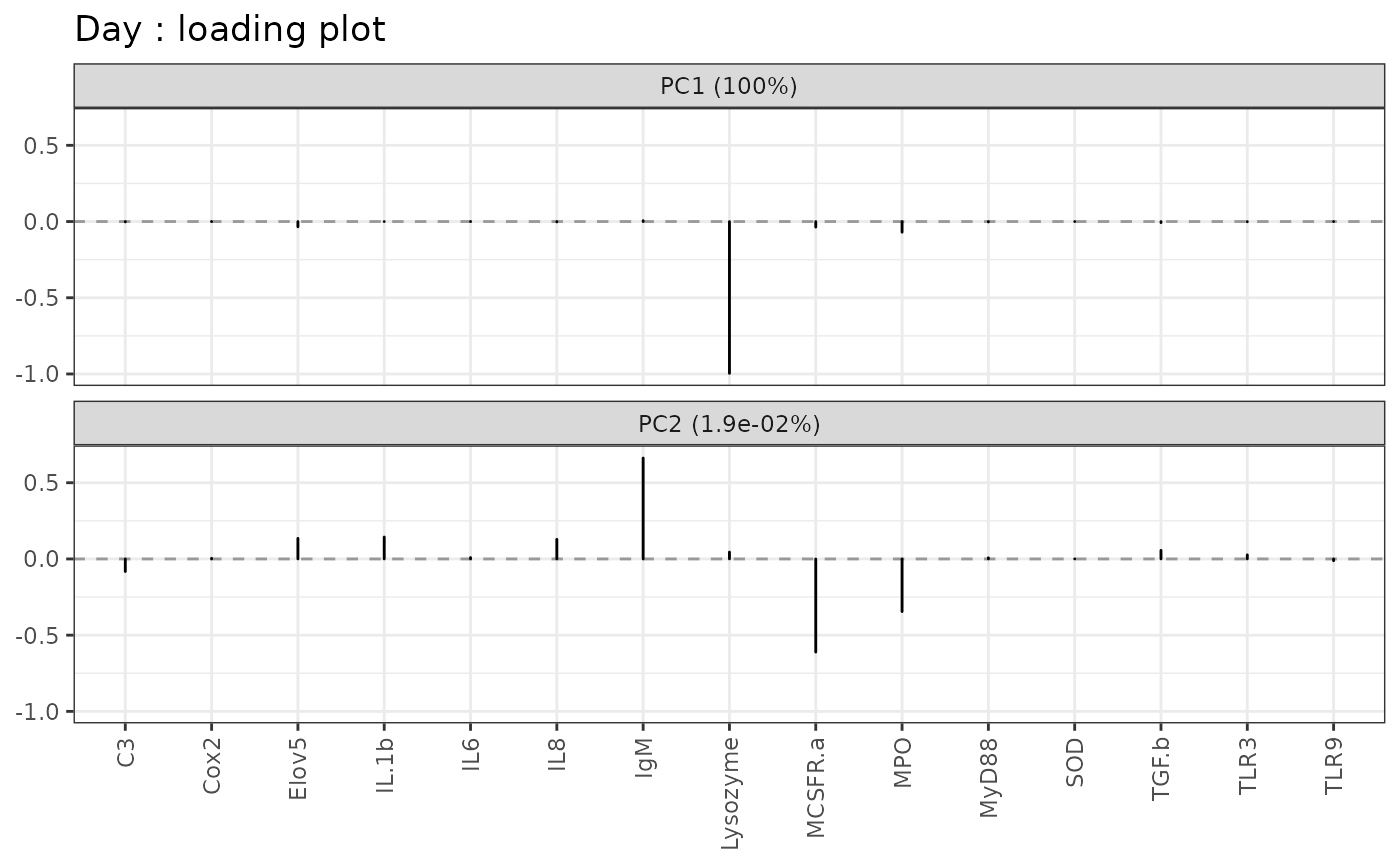
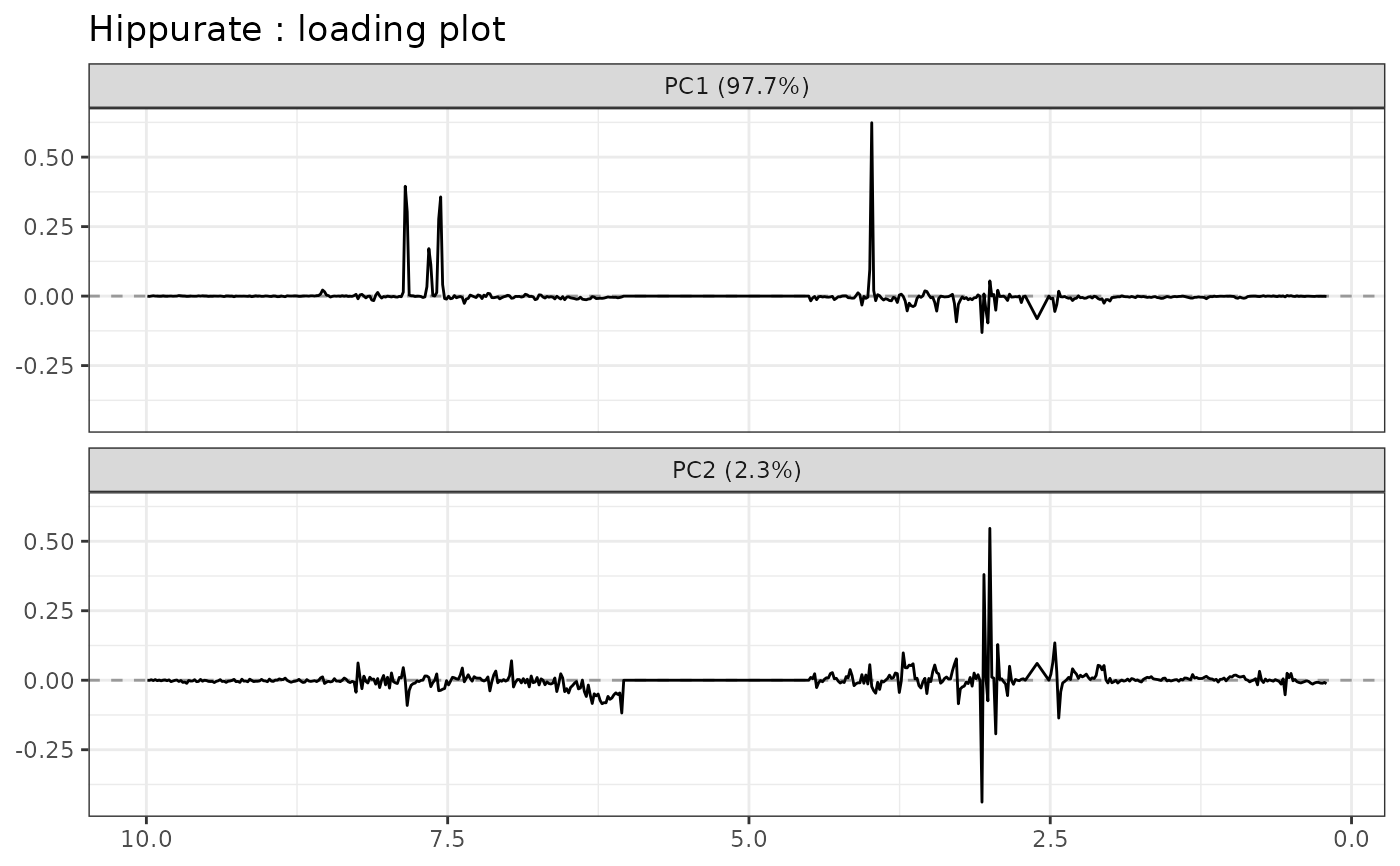
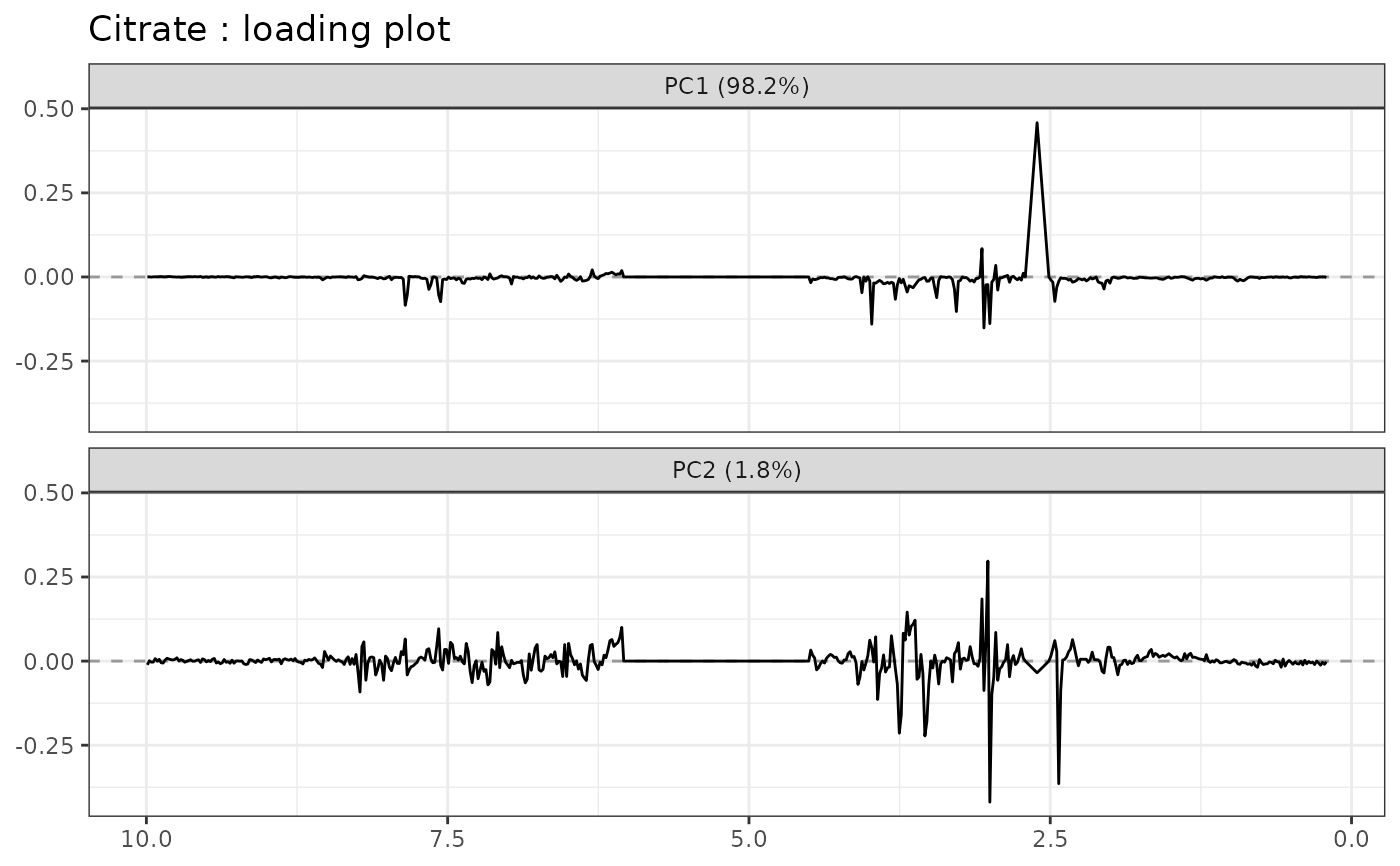
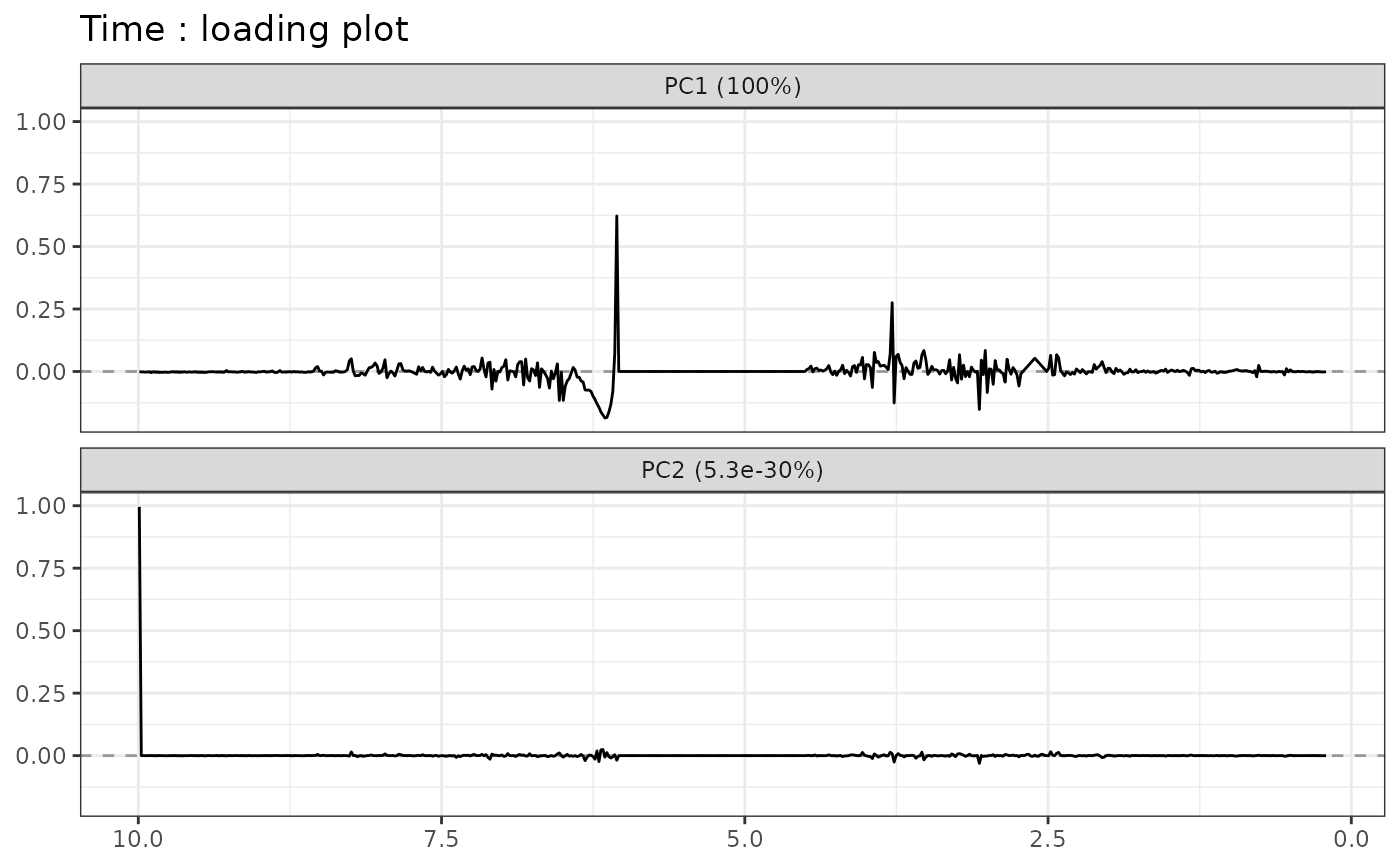
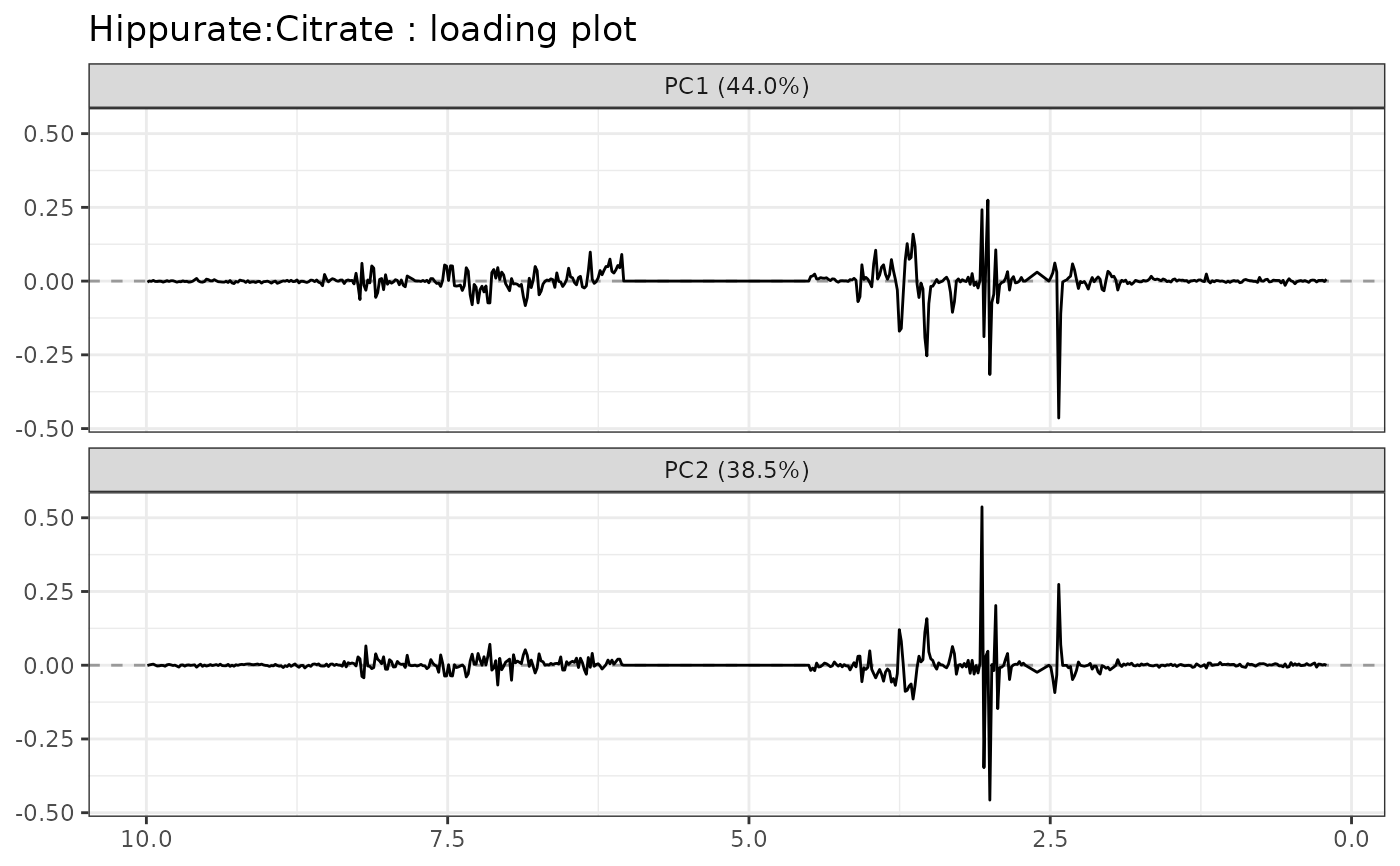
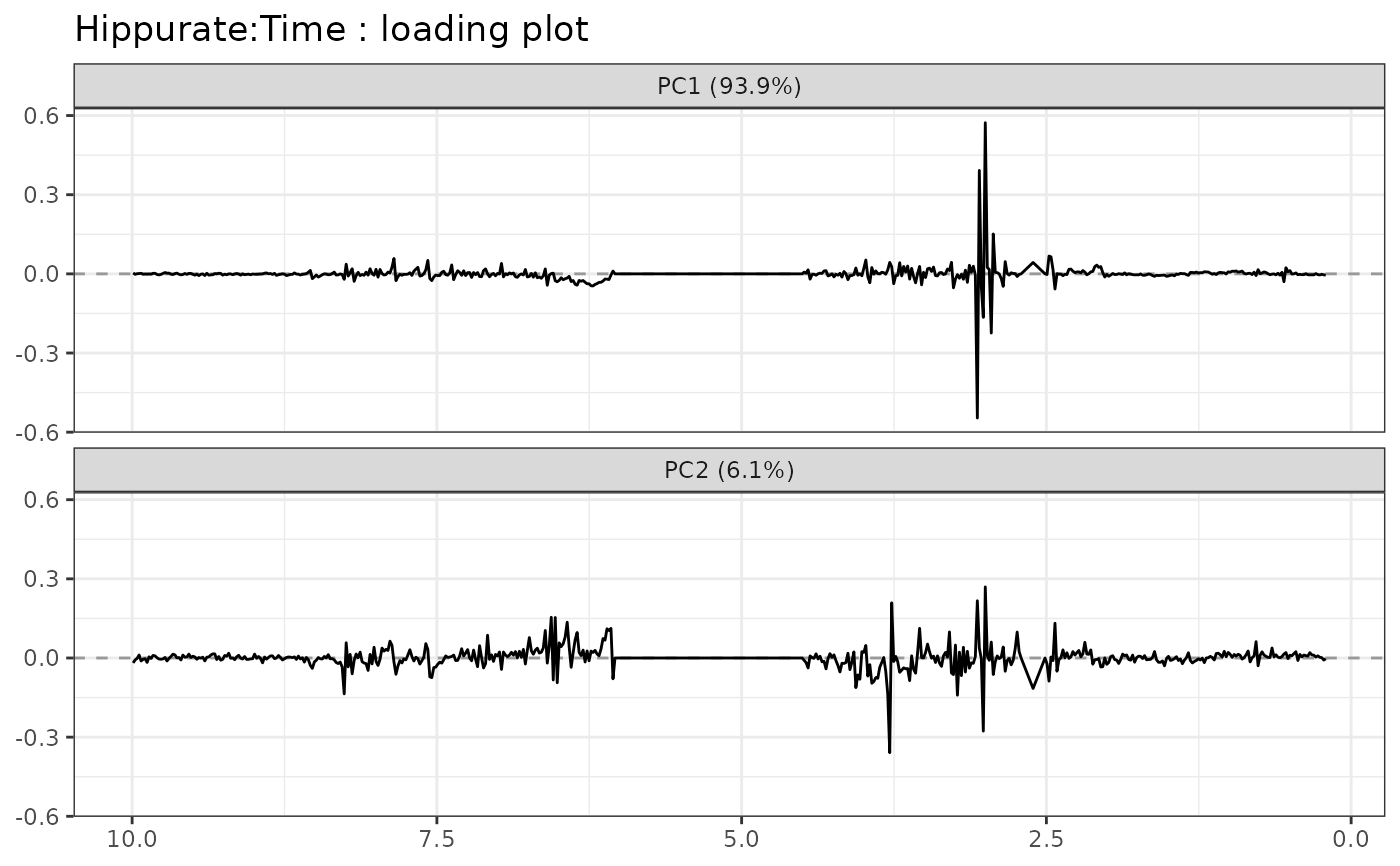
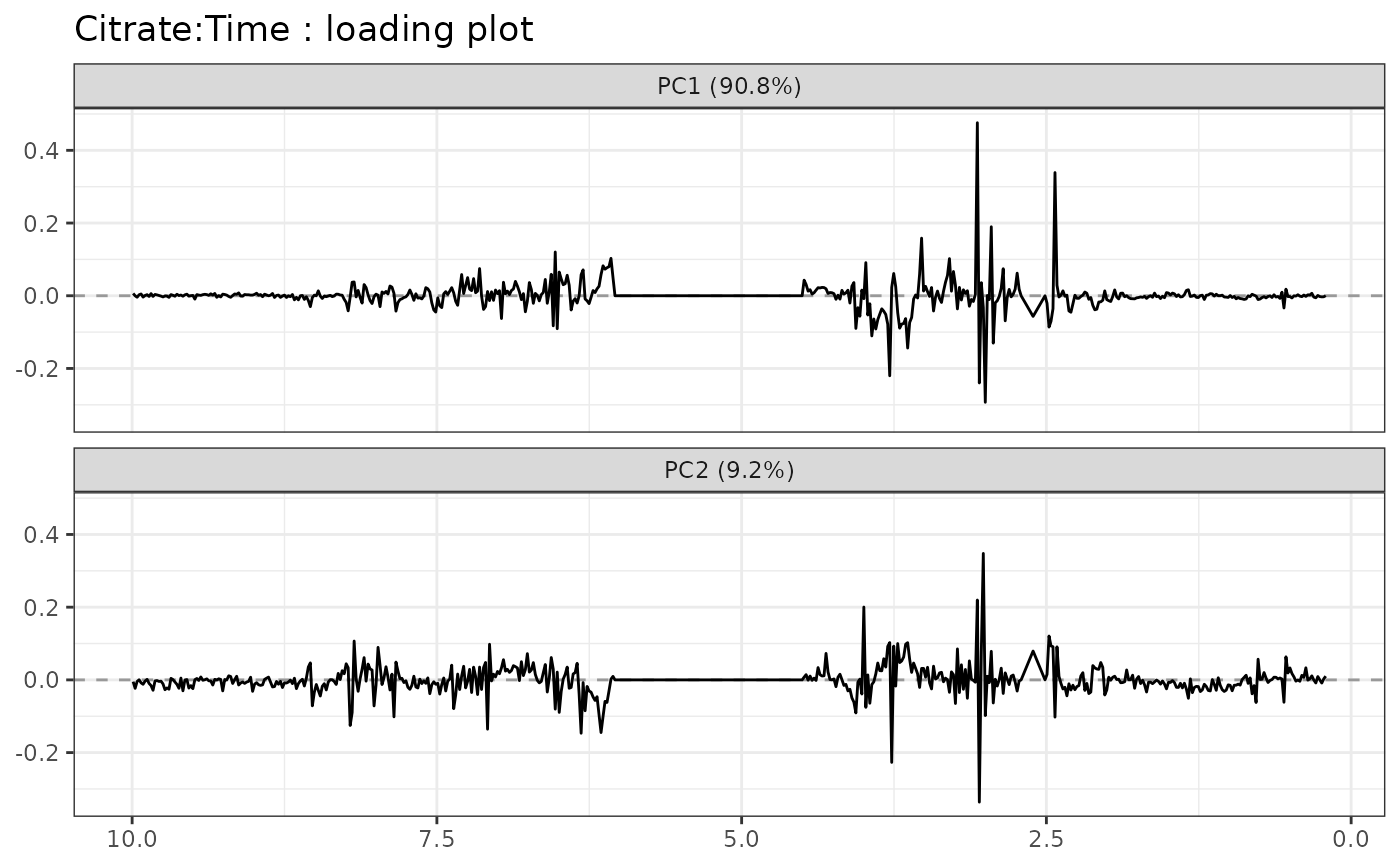
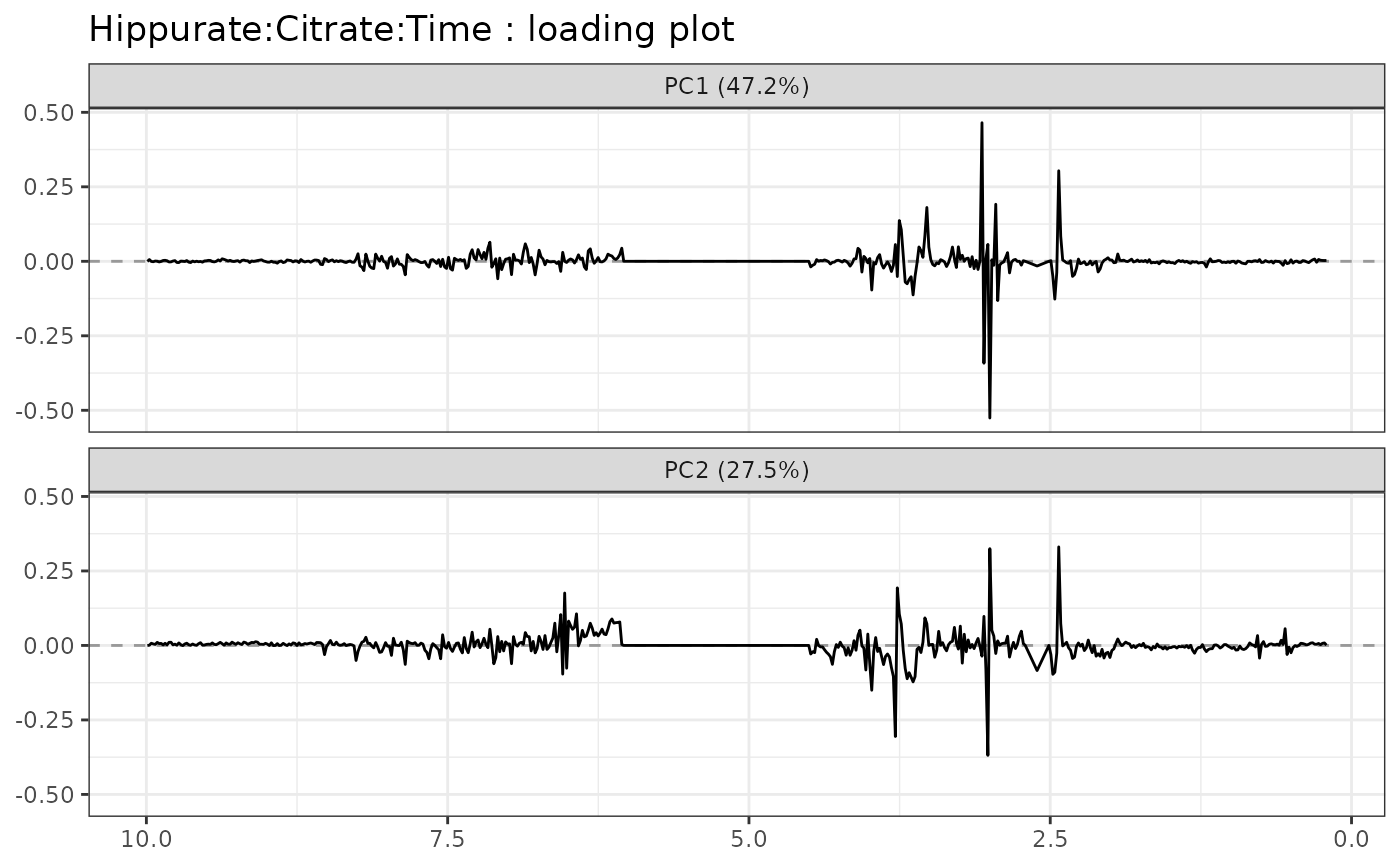
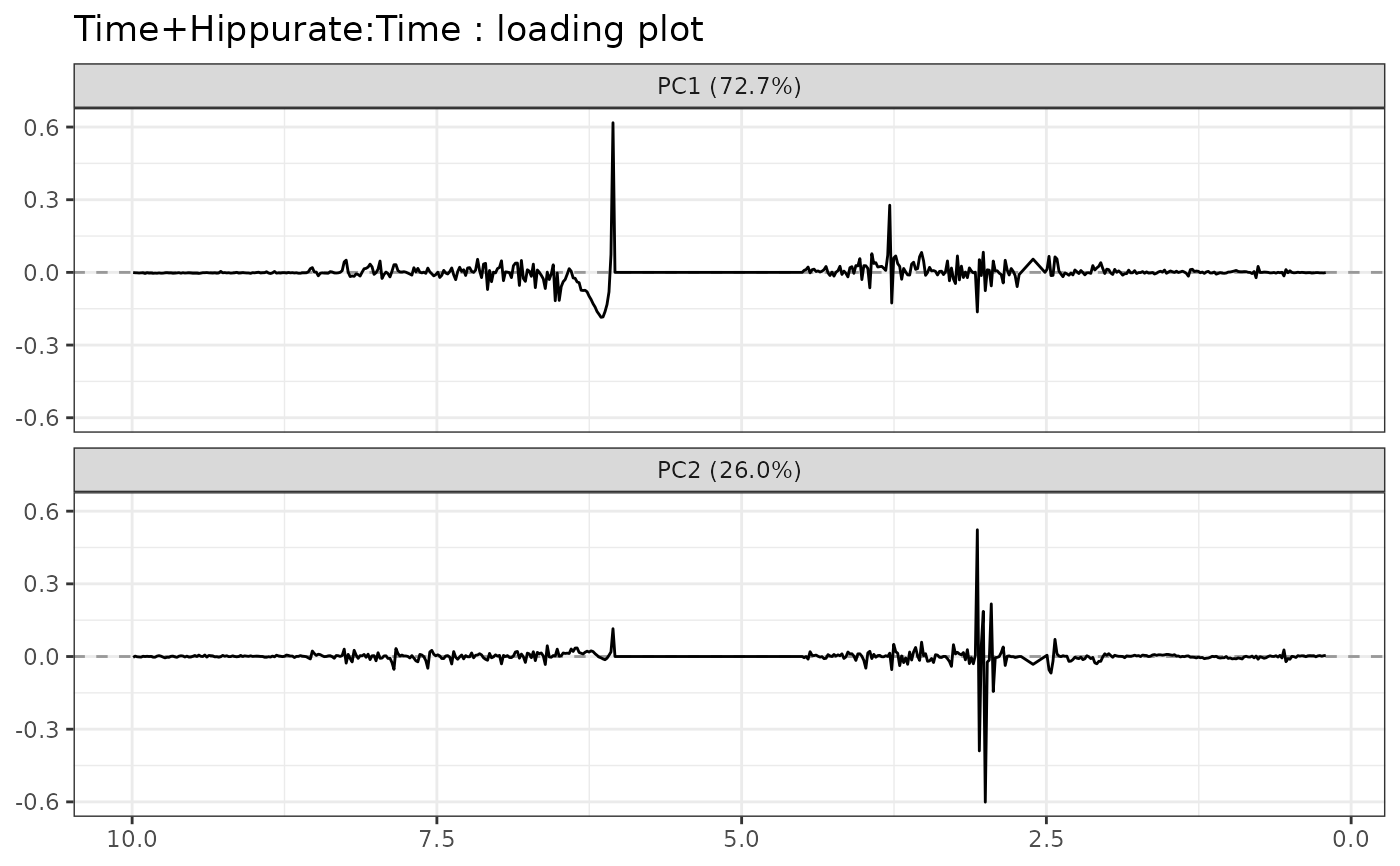
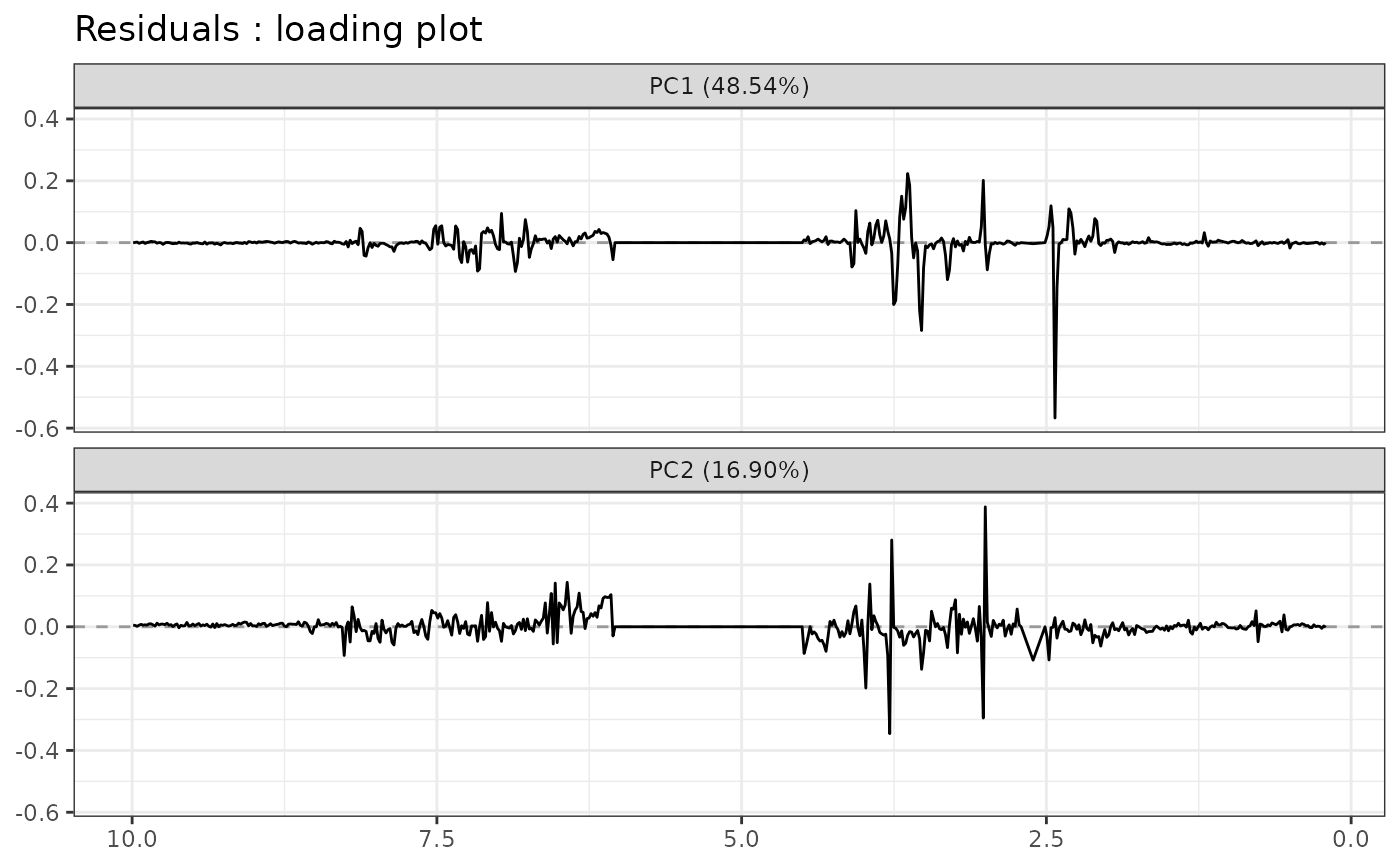
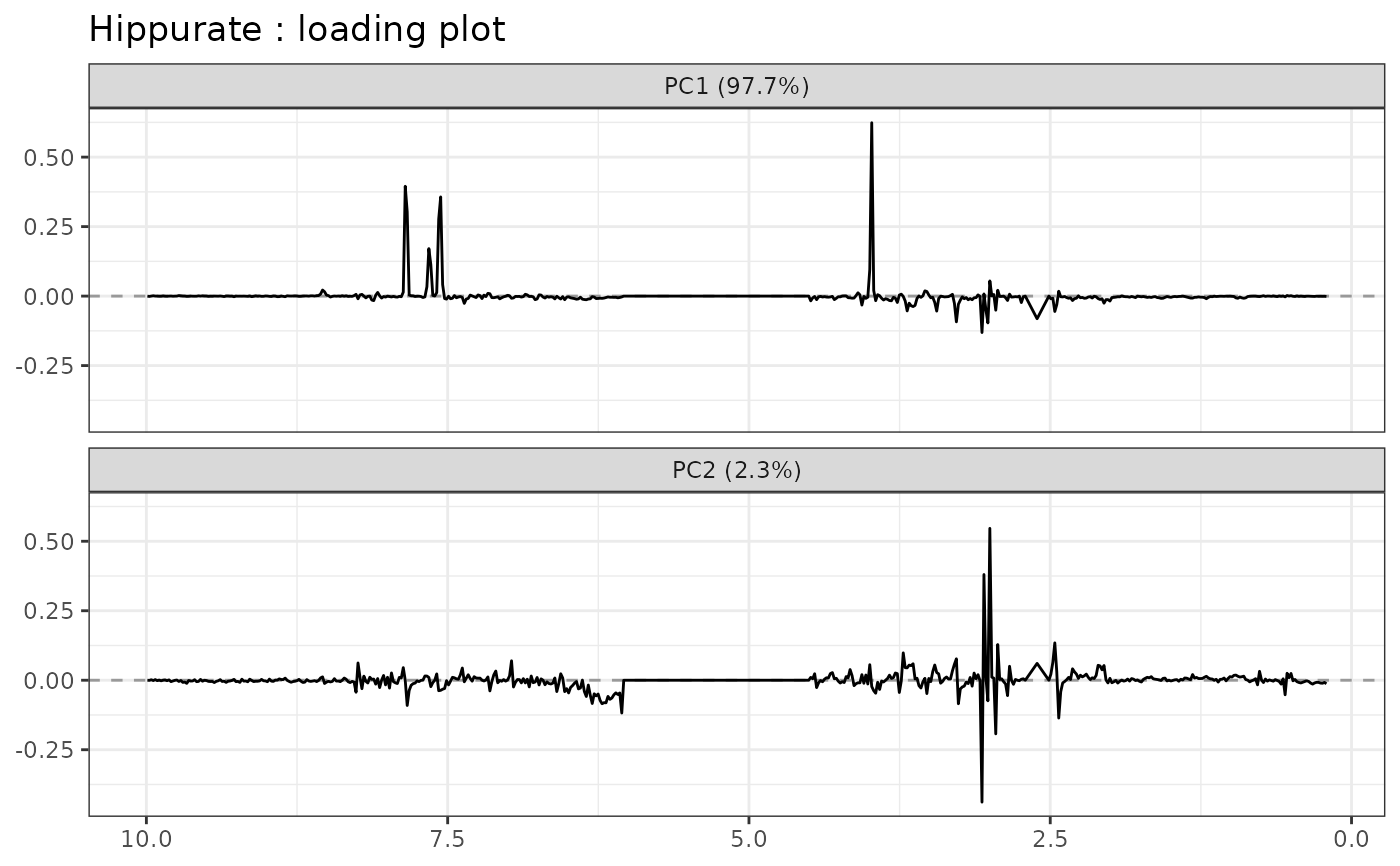
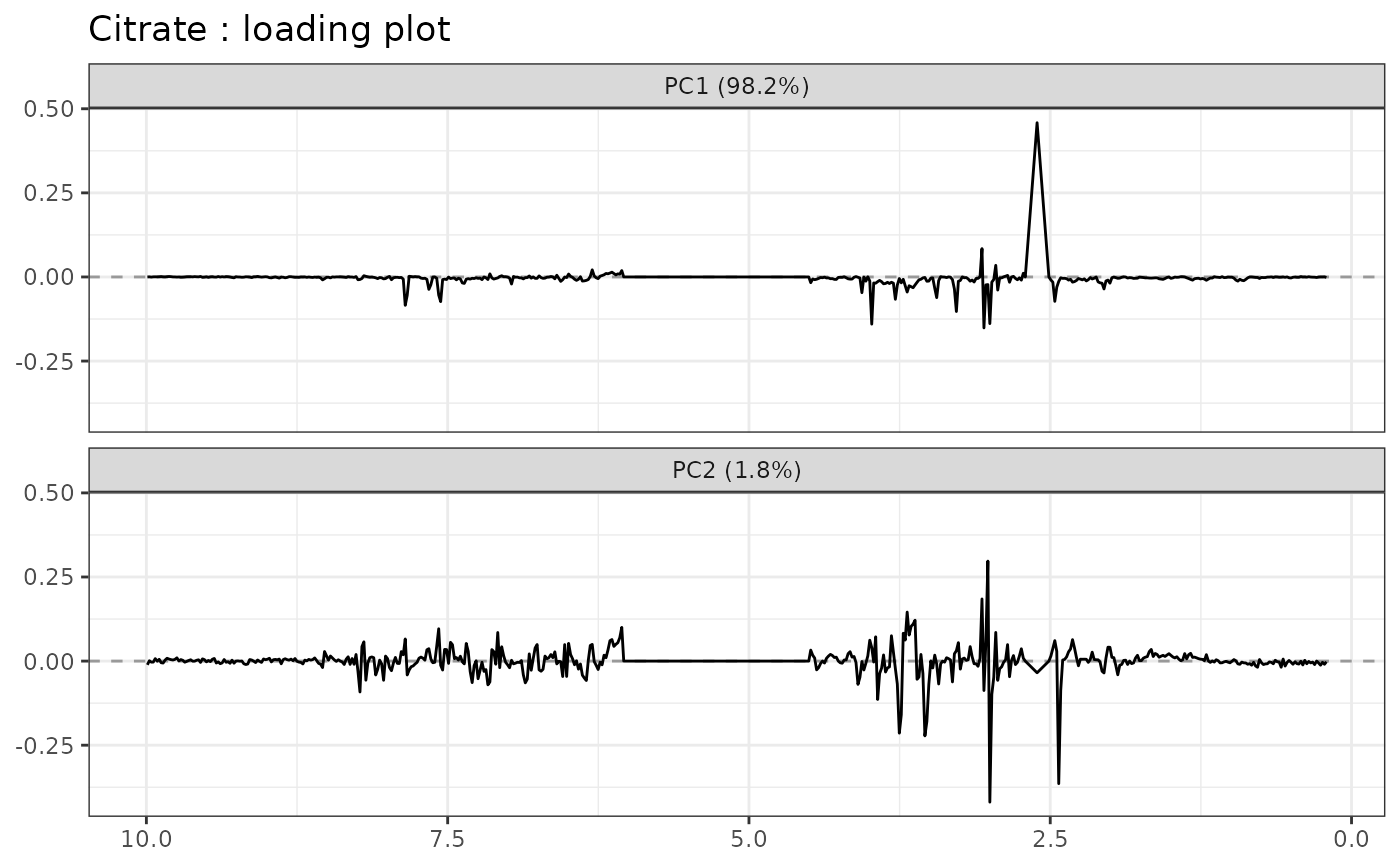
Plots the loading vectors for each effect matrix from the lmpPcaEffects outputs with line plots. This is a wrapper of plotLine.
Usage
lmpLoading1dPlot(resLmpPcaEffects, effectNames = NULL, axes = c(1, 2), ...)Arguments
- resLmpPcaEffects
A list corresponding to the output value of
lmpPcaEffects.- effectNames
Names of the effects to be plotted. if
NULL, all the effects are plotted.- axes
A numerical vector with the Principal Components axes to be drawn.
- ...
Additional arguments to be passed to
plotLinesuch asxaxis_type,typeorang_x_axis.
Details
lmpLoading1dPlot is a wrapper of plotLine. See ?plotLine for more information on the additional arguments.
Examples
# Example of "spectral" type loadings (line and numerical x-axis)
data("UCH")
resLmpModelMatrix <- lmpModelMatrix(UCH)
resLmpEffectMatrices <- lmpEffectMatrices(resLmpModelMatrix)
resASCA <- lmpPcaEffects(resLmpEffectMatrices,
combineEffects = list(c("Time", "Hippurate:Time"))
)
lmpLoading1dPlot(resASCA)
#> $Hippurate
 #>
#> $Citrate
#>
#> $Citrate
 #>
#> $Time
#>
#> $Time
 #>
#> $`Hippurate:Citrate`
#>
#> $`Hippurate:Citrate`
 #>
#> $`Hippurate:Time`
#>
#> $`Hippurate:Time`
 #>
#> $`Citrate:Time`
#>
#> $`Citrate:Time`
 #>
#> $`Hippurate:Citrate:Time`
#>
#> $`Hippurate:Citrate:Time`
 #>
#> $`Time+Hippurate:Time`
#>
#> $`Time+Hippurate:Time`
 #>
#> $Residuals
#>
#> $Residuals
 #>
lmpLoading1dPlot(resASCA, effectNames = c("Hippurate", "Citrate"))
#> $Hippurate
#>
lmpLoading1dPlot(resASCA, effectNames = c("Hippurate", "Citrate"))
#> $Hippurate
 #>
#> $Citrate
#>
#> $Citrate
 #>
# Example of "segment" and discrete type loadings (segments and character x-axis)
data("trout")
resLmpModelMatrix <- lmpModelMatrix(trout)
resLmpEffectMatrices <- lmpEffectMatrices(resLmpModelMatrix)
resASCA <- lmpPcaEffects(resLmpEffectMatrices)
lmpLoading1dPlot(resASCA,
effectNames = "Day",
xaxis_type = "character", type = "s", ang_x_axis = 90
)
