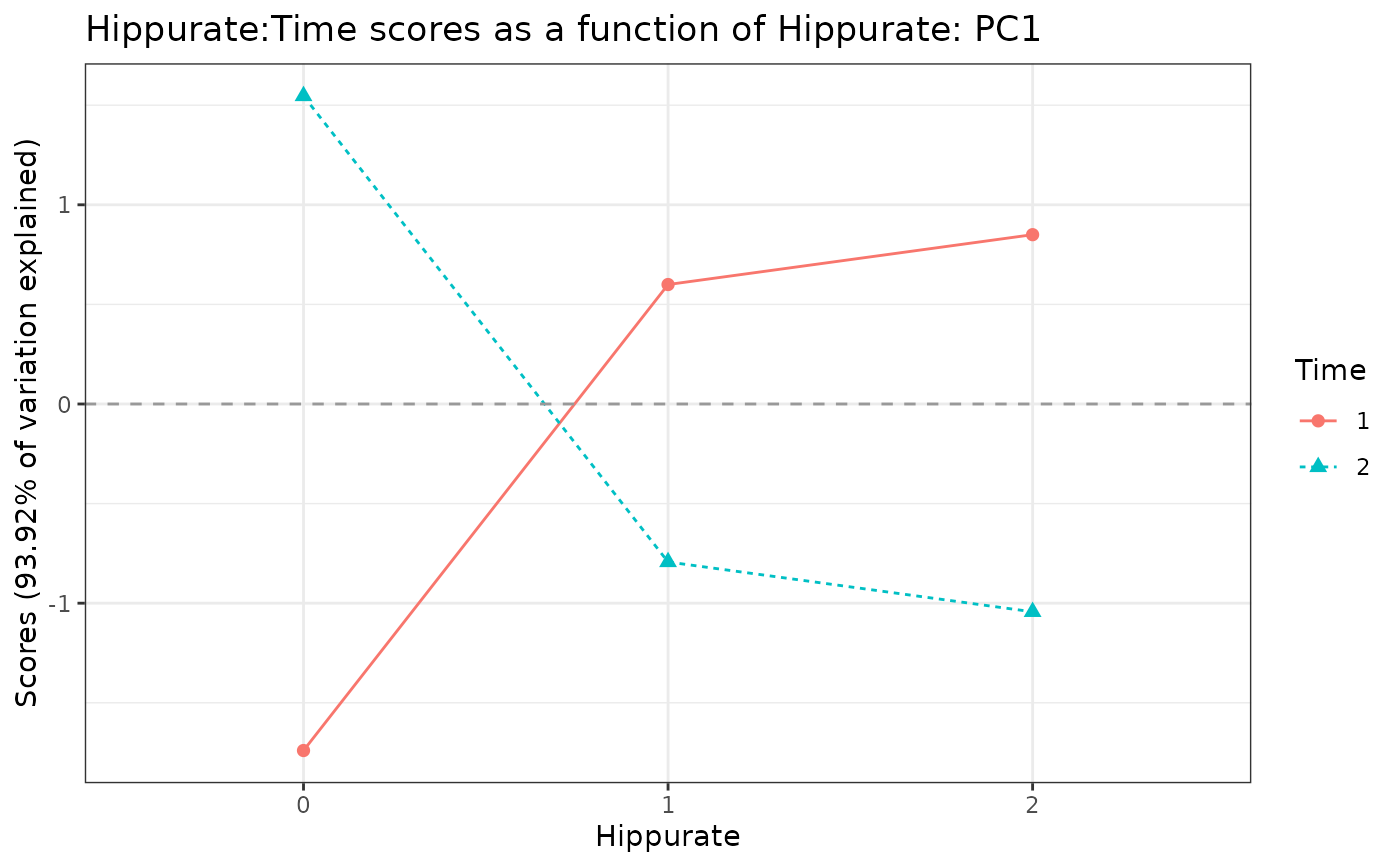
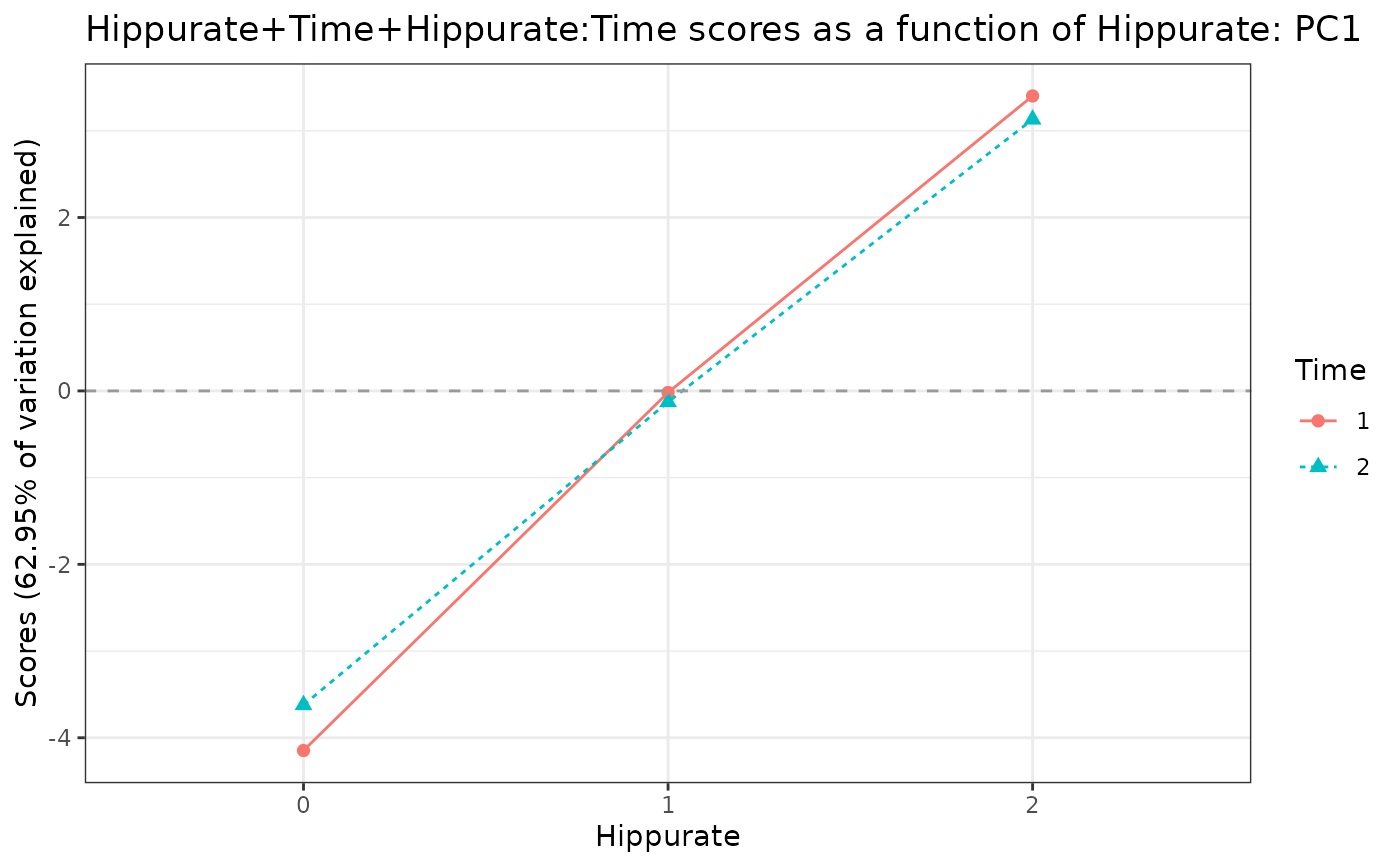
Plots the ASCA scores by effect levels for a given model effect and for one PC at a time. This graph is especially appealing to interpret interactions or combined effects. It is a wrapper of plotMeans.
Arguments
- resASCA
A list corresponding to the ASCA output value of
lmpPcaEffects.- effectName
Name of the effect to be used to plot the scores.
- axes
A numerical vector with the Principal Components axes to be drawn.
- x
A character string giving the
designfactor whose levels will form the x axis.- z
A character string giving the
designfactor whose levels will form the traces.- w
A character string giving the
designfactor whose levels will be used for the facet.- hline
If not
NULL, draws one or several horizontal line(s) at values given inhline.- ...
Additional arguments to be passed to
plotMeans.
Details
lmpEffectPlot is a wrapper of plotMeans.
Examples
data("UCH")
resLmpModelMatrix <- lmpModelMatrix(UCH)
resLmpEffectMatrices <- lmpEffectMatrices(resLmpModelMatrix)
resASCA <- lmpPcaEffects(
  resLmpEffectMatrices = resLmpEffectMatrices,
  method = "ASCA", combineEffects = list(c("Hippurate", "Time", "Hippurate:Time"))
)

# Effect plot for an interaction effect
lmpEffectPlot(resASCA, effectName = "Hippurate:Time", x = "Hippurate", z = "Time")

# Effect plot for a combined effect
lmpEffectPlot(resASCA, effectName = "Hippurate+Time+Hippurate:Time", x = "Hippurate", z = "Time")
