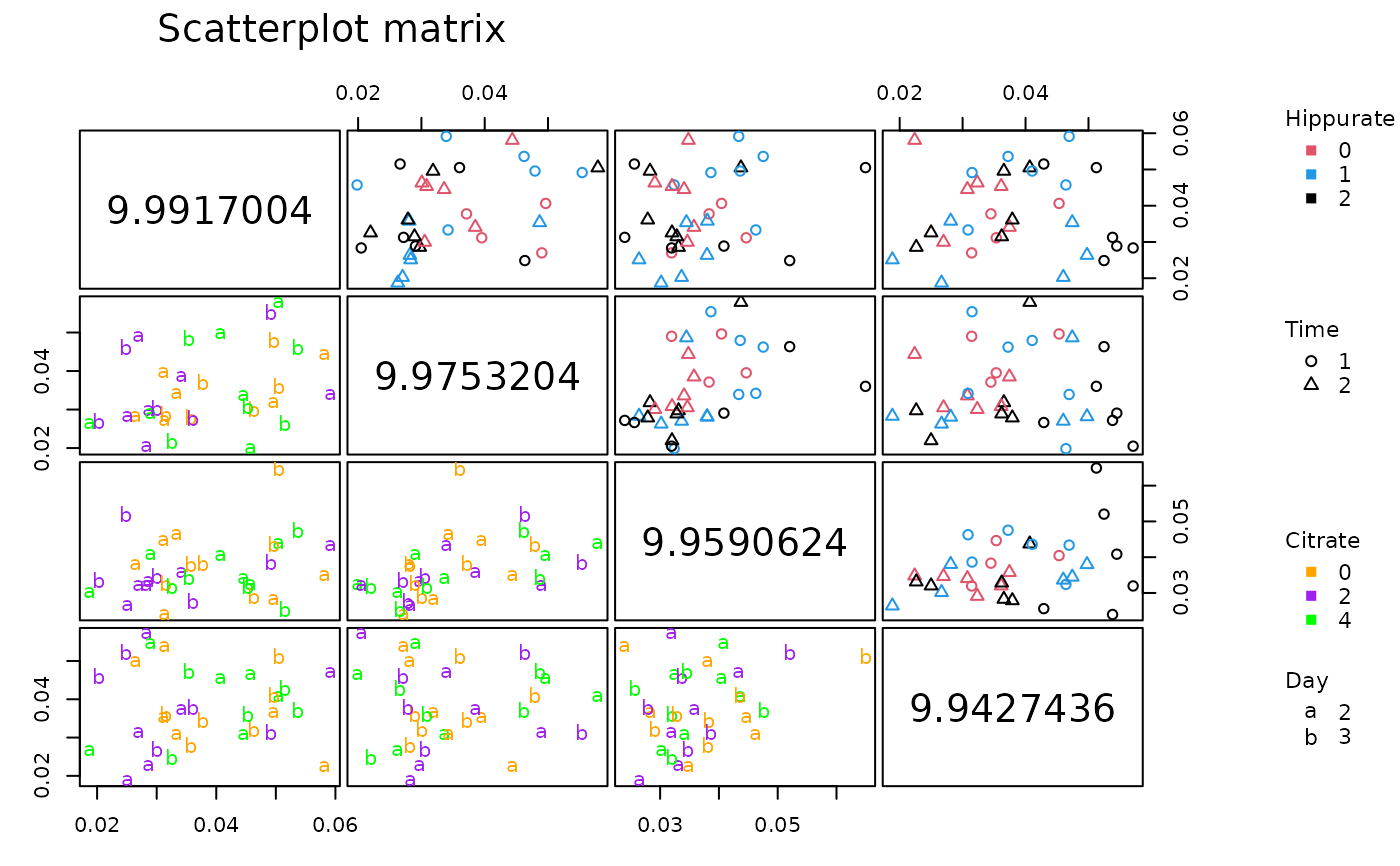
Produces a scatter plot matrix between the selected columns of the outcomes matrix \(Y\) choosing specific colors and symbols for up to four factors from the design on the upper and lower diagonals.
Usage
plotScatterM(
  Y = NULL,
  design = NULL,
  lmpDataList = NULL,
  cols,
  labelVector = NULL,
  title = "Scatterplot matrix",
  varname.colorup = NULL,
  varname.colordown = NULL,
  varname.pchup = NULL,
  varname.pchdown = NULL,
  vec.colorup = NULL,
  vec.colordown = NULL,
  vec.pchup = NULL,
  vec.pchdown = NULL
)
Arguments
- Y
\(n \times m\) matrix with \(n\) observations and \(m\) variables. Can be
NULLiflmpDataListis defined.- design
A \(n \times k\) "freely encoded" experimental design data.frame. Can be
NULLiflmpDataListis defined.- lmpDataList
If not
NULL, a list with outcomes, design and formula, as outputted bydata2LmpDataList.- cols
A vector with either the column names of the \(Y\) matrix to plot (character) or the column index positions.
- labelVector
Labels to display on the diagonal. If
NULL, the column names are deduced fromcols.- title
Title of the graph.
- varname.colorup
A character string with the name of the variable used to color the upper triangle.
- varname.colordown
A character string with the name of the variable used to color the lower triangle.
- varname.pchup
A character string with the name of the variable used to mark points for the upper triangle.
- varname.pchdown
A character string with the name of the variable used to mark points for the lower triangle.
- vec.colorup
A color vector (character or numeric) with a length equal to the number of levels of
varname.colorup.- vec.colordown
A color vector (character or numeric) with a length equal to the number of levels of
varname.colordown.- vec.pchup
A symbol vector (character or numeric) with a length equal to the number of levels of
varname.pchup.- vec.pchdown
A symbol vector (character or numeric) with a length equal to the number of levels of
varname.pchdown.
Details
Either Y or lmpDataList need to be defined. If both are given, the priority goes to Y.
The same rule applies for design or lmpDataList.
Examples
data("UCH")

# basic usage
plotScatterM(
  Y = UCH$outcomes, design = UCH$design, cols = c(1:4)
)

# equivalent to:
plotScatterM(
  lmpDataList = UCH, cols = c(1:4)
)


# with optionnal arguments
plotScatterM(
  Y = UCH$outcomes, design = UCH$design, cols = c(1:4),
  varname.colorup = "Hippurate", varname.colordown = "Citrate",
  varname.pchup = "Time", varname.pchdown = "Day",
  vec.colorup = c(2, 4, 1),
  vec.colordown = c("orange", "purple", "green"),
  vec.pchup = c(1, 2), vec.pchdown = c("a", "b")
)
