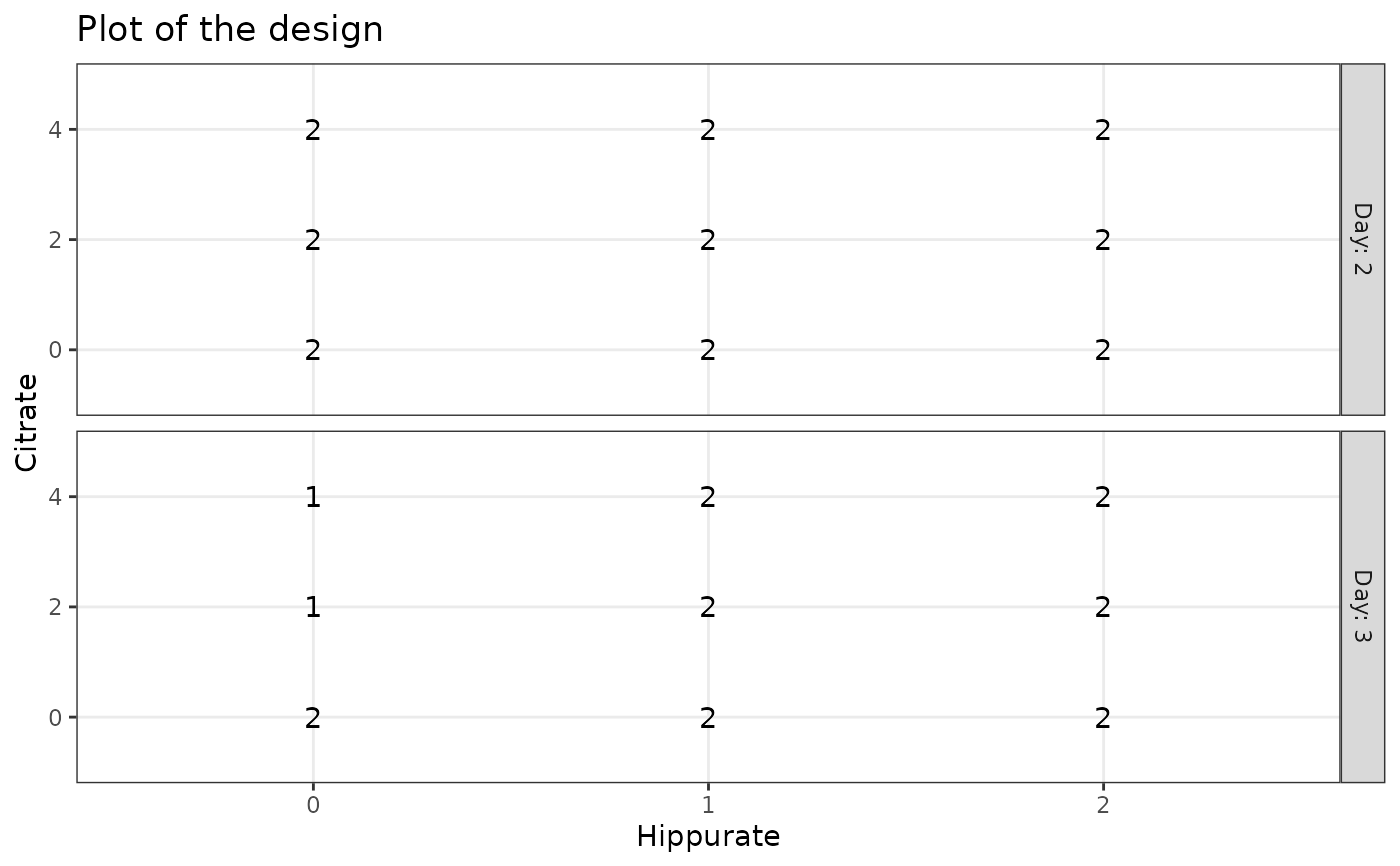
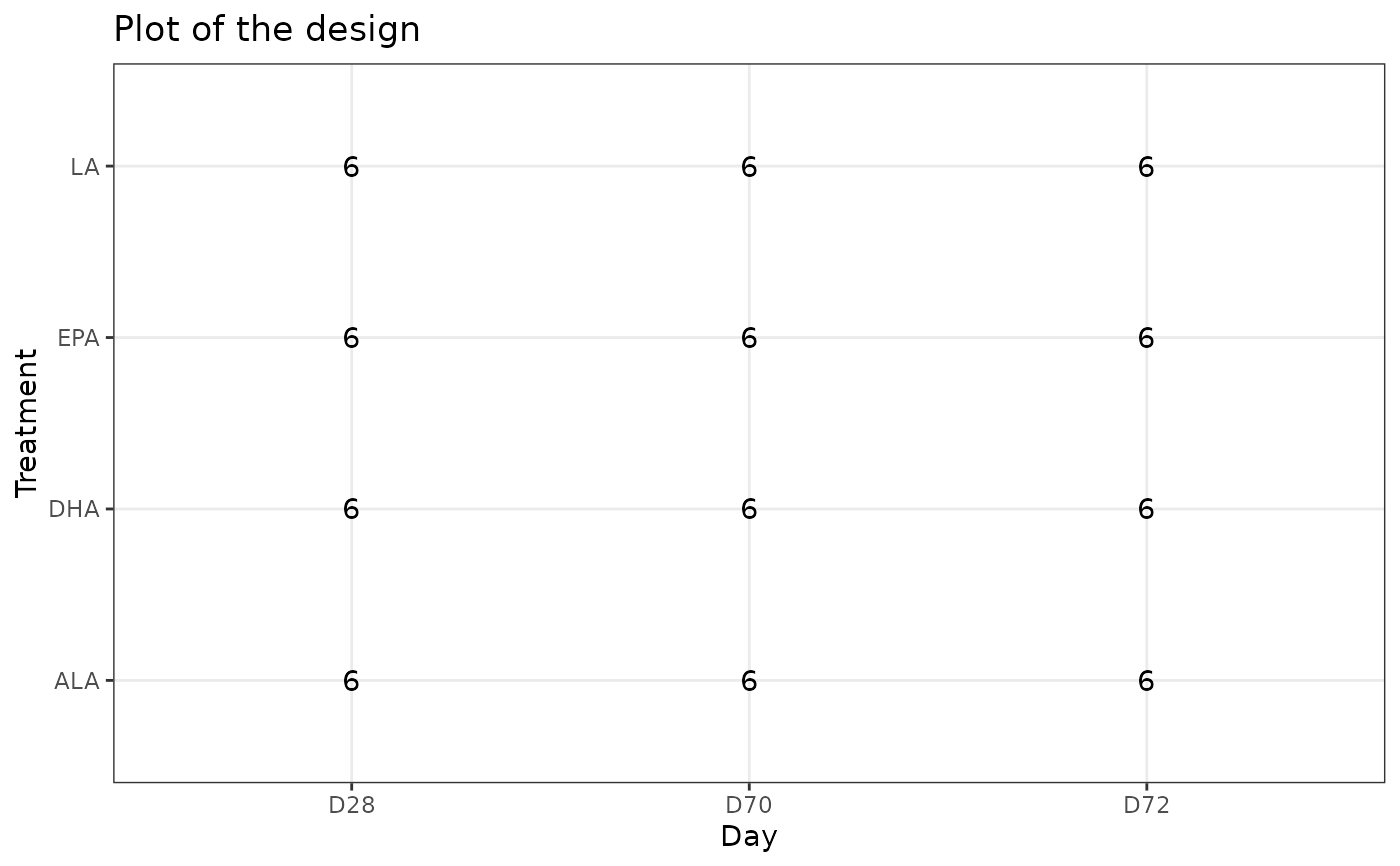
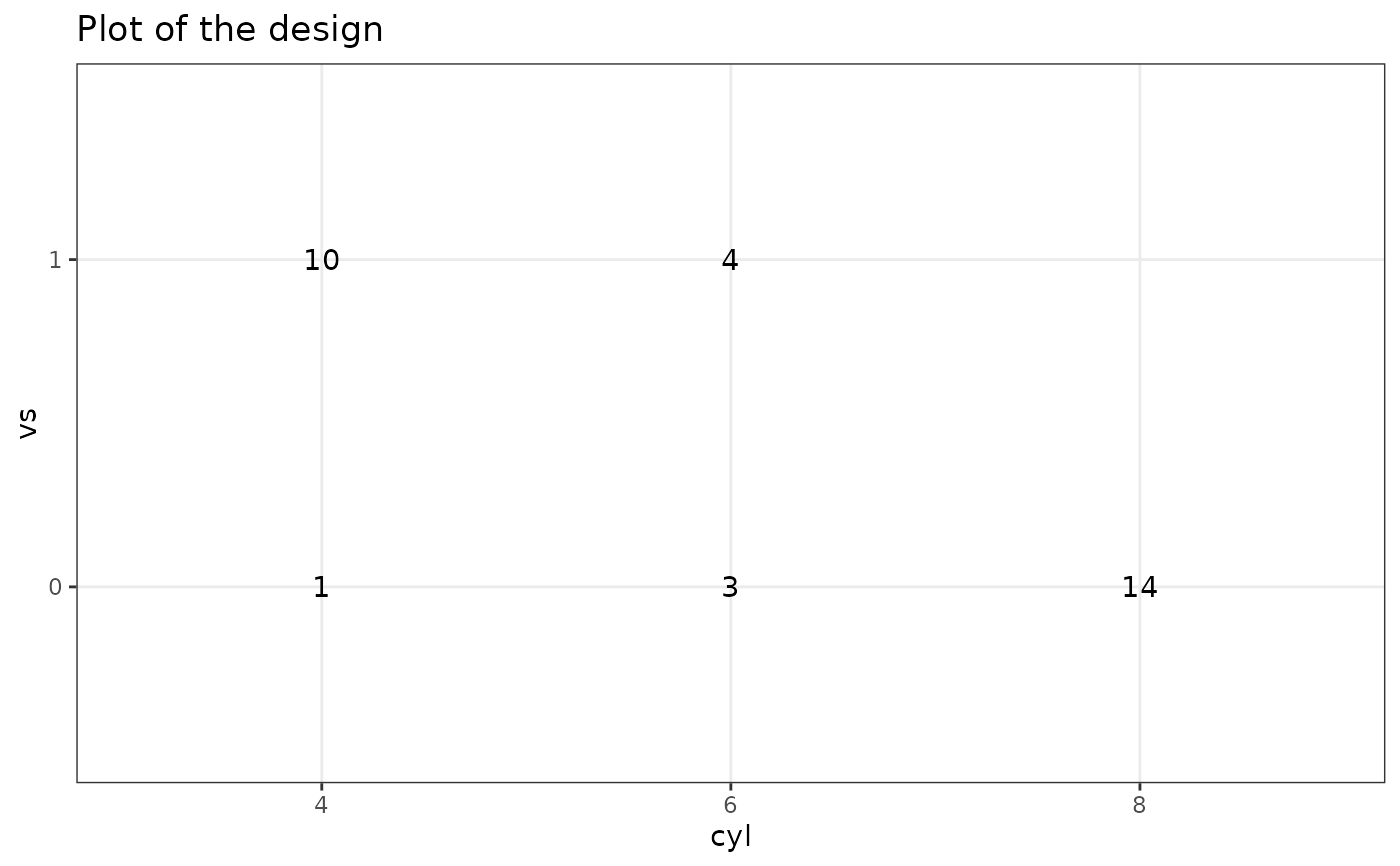
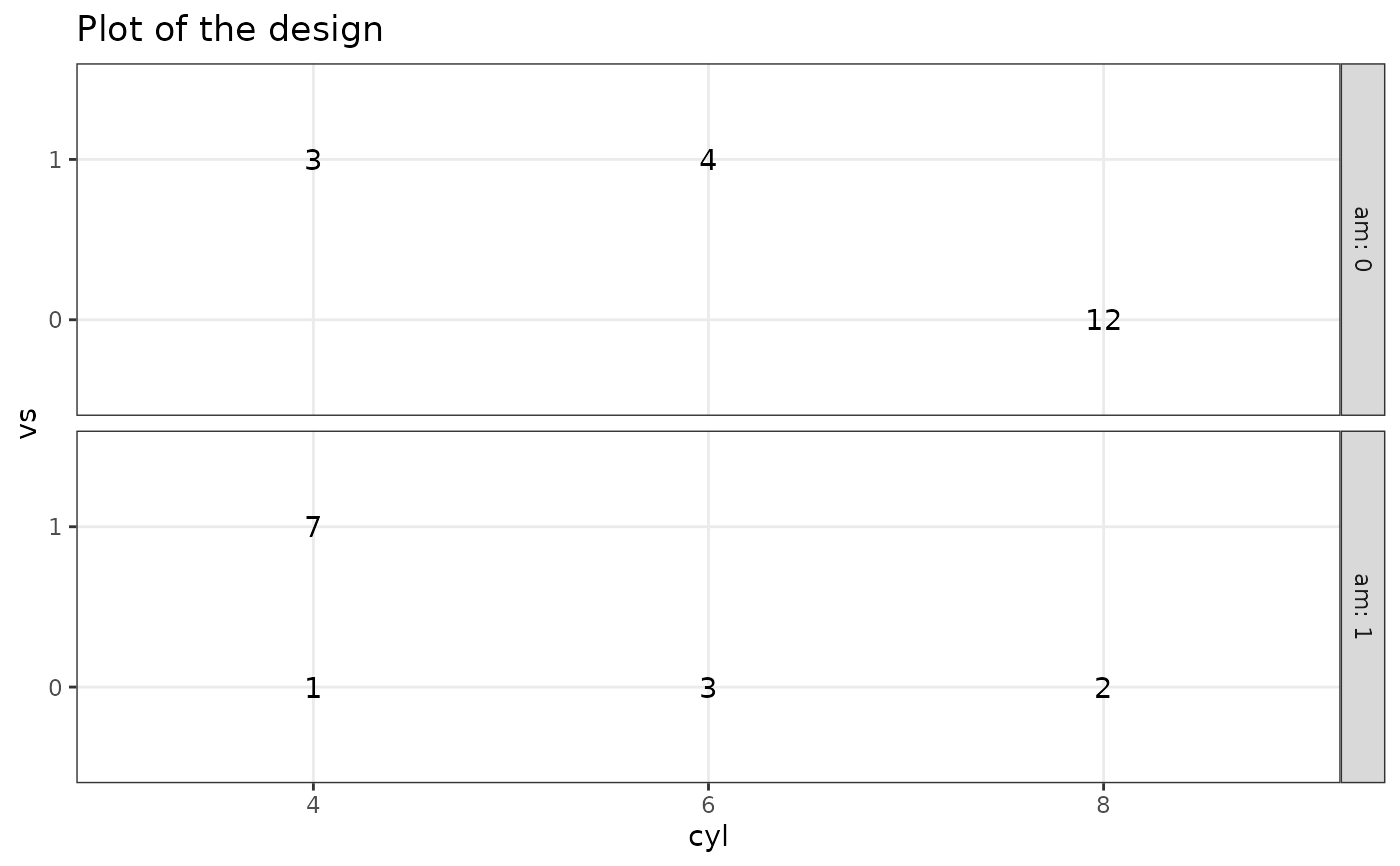
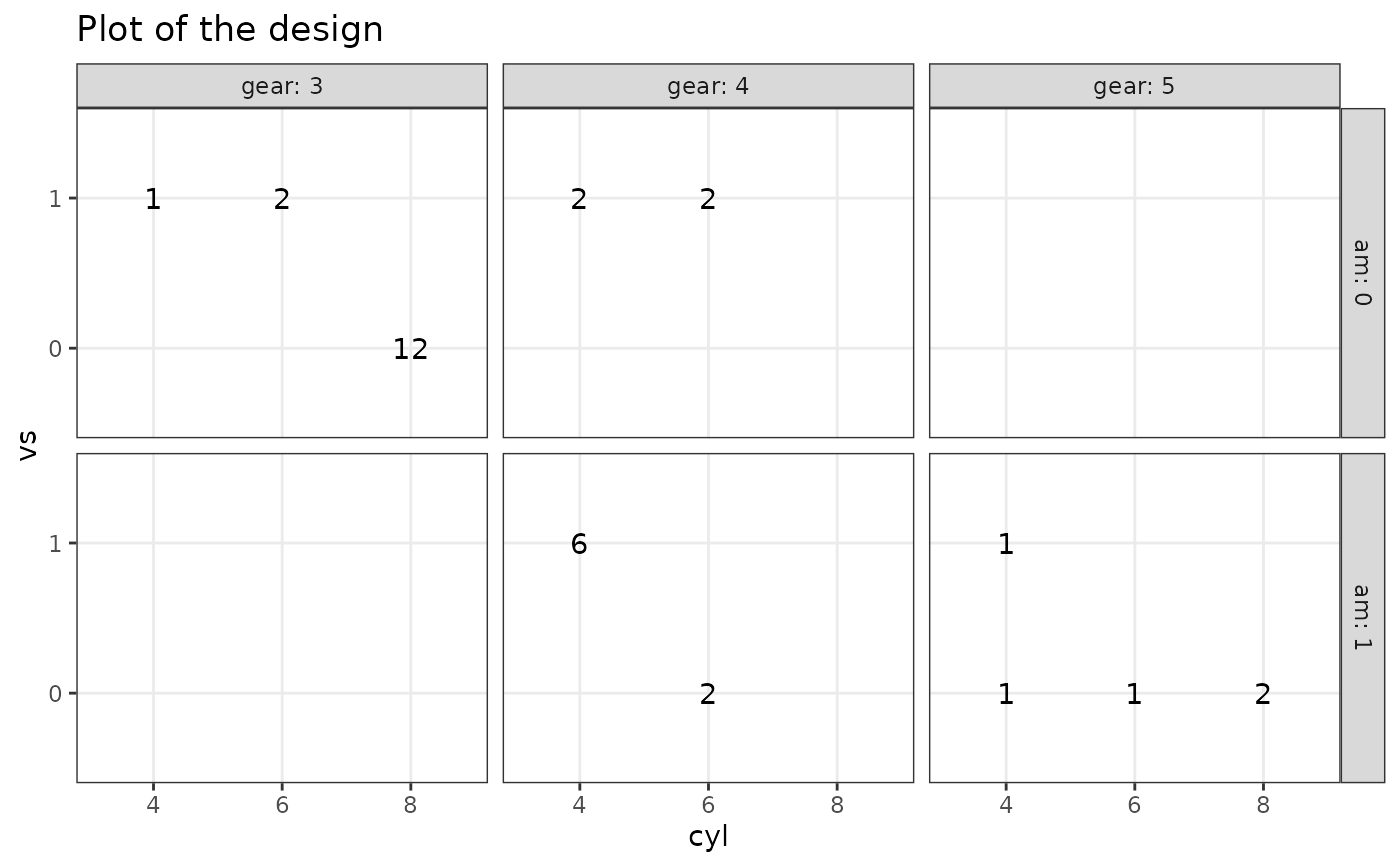
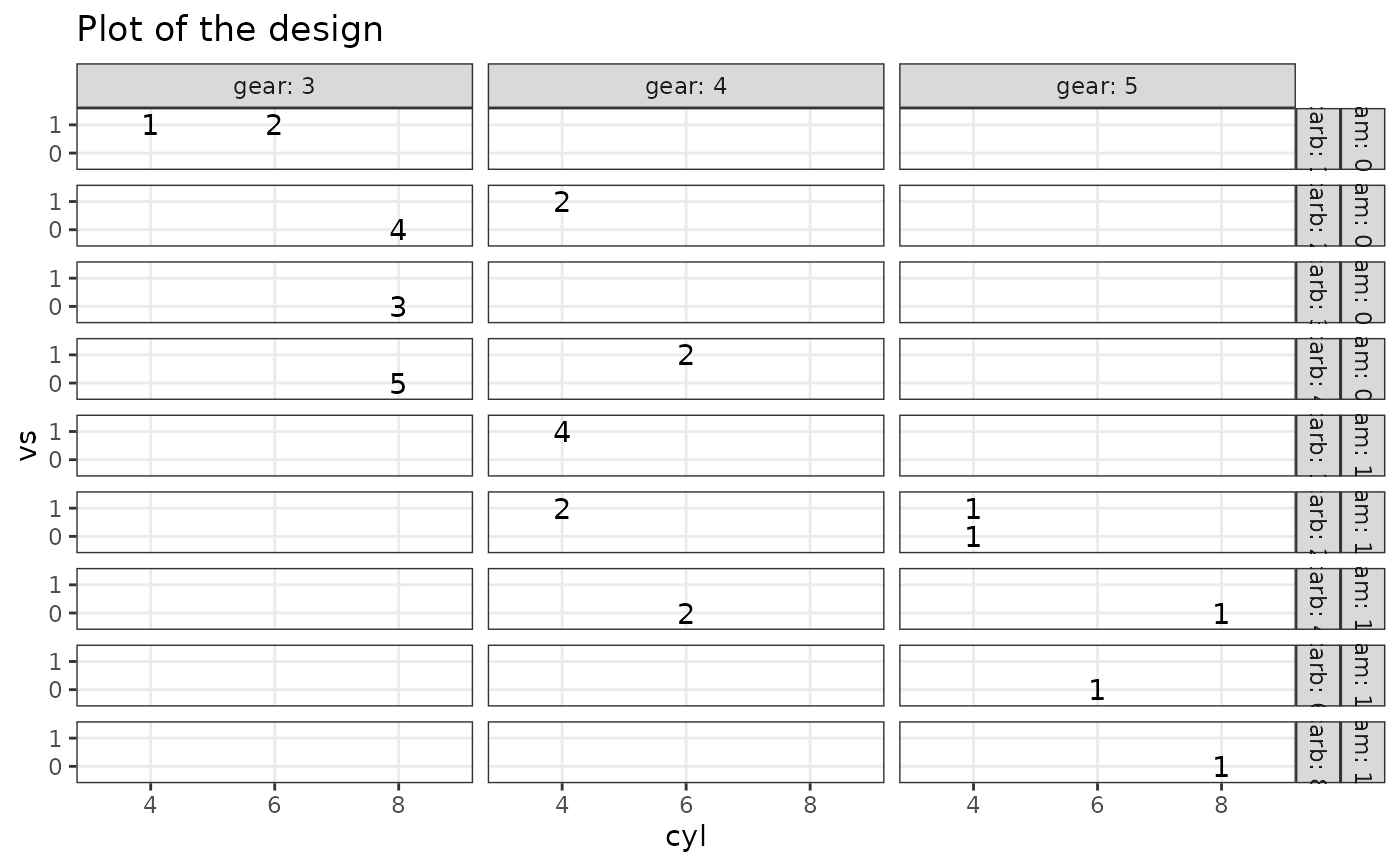
Provides a graphical representation of the experimental design. It allows to visualize factors levels and check the design balance.
Usage
plotDesign(
  design = NULL,
  lmpDataList = NULL,
  x = NULL,
  y = NULL,
  rows = NULL,
  cols = NULL,
  title = "Plot of the design",
  theme = theme_bw()
)
Arguments
- design
A data.frame representing the \(n \times k\) "freely encoded" experimental design. Can be
NULLiflmpDataListis defined.- lmpDataList
If not
NULL, a list with outcomes, design and formula, as outputted bydata2LmpDataList.- x
By default, the first column of
design; otherwise if notNULL, a character string giving the column name ofdesignto be used for the x-axis. The column needs to be a factor.- y
By default, the second column of
designif present ; otherwise if notNULL, a character string giving the column name ofdesignto be used for the y-axis.- rows
By default, the fourth column of
designif present ; otherwise if notNULL, a character vector with one or several column name(s) ofdesignto be used for faceting along the rows. The column needs to be a factor.- cols
By default, the third column of
designif present ; otherwise if notNULL, a character vector with one or several column name(s) ofdesignto be used for faceting along the columns. The column needs to be a factor.- title
Plot title.
- theme
The
ggplot2theme, see?ggthemefor more info.
Details
Either design or lmpDataList need to be defined. If both are given, the priority goes to design.
The default behavior (parameters x, y, cols and rows are NULL) uses the first four columns of df. If at least one of these arguments is not NULL, the function will only use the non NULL parameters to be displayed.
Examples
### trout data
data(trout)
plotDesign(design = trout$design, x = "Day", y = "Treatment")
 # equivalent to:
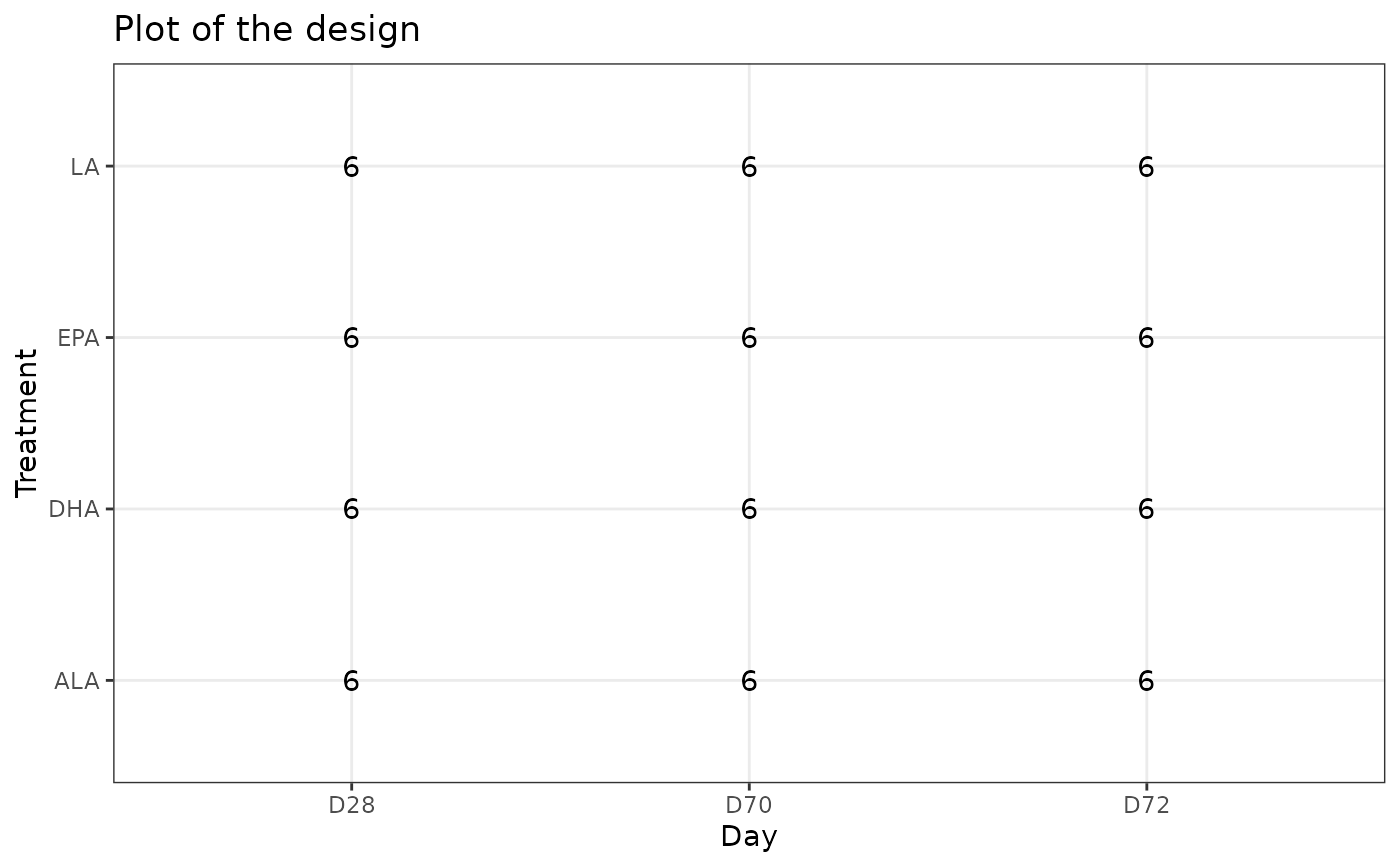
plotDesign(lmpDataList = trout, x = "Day", y = "Treatment")
 ### mtcars
data(mtcars)
library(tidyverse)
#> ── Attaching core tidyverse packages ──────────────────────── tidyverse 2.0.0 ──
#> ✔ dplyr 1.1.4 ✔ readr 2.1.5
#> ✔ forcats 1.0.0 ✔ stringr 1.5.1
#> ✔ ggplot2 3.5.1 ✔ tibble 3.2.1
#> ✔ lubridate 1.9.3 ✔ tidyr 1.3.1
#> ✔ purrr 1.0.2
#> ── Conflicts ────────────────────────────────────────── tidyverse_conflicts() ──
#> ✖ lubridate::%within%() masks IRanges::%within%()
#> ✖ ggplot2::Position() masks BiocGenerics::Position(), base::Position()
#> ✖ dplyr::collapse() masks IRanges::collapse()
#> ✖ dplyr::combine() masks Biobase::combine(), BiocGenerics::combine()
#> ✖ dplyr::count() masks matrixStats::count()
#> ✖ dplyr::desc() masks IRanges::desc()
#> ✖ tidyr::expand() masks S4Vectors::expand()
#> ✖ dplyr::filter() masks stats::filter()
#> ✖ dplyr::first() masks S4Vectors::first()
#> ✖ dplyr::lag() masks stats::lag()
#> ✖ purrr::reduce() masks GenomicRanges::reduce(), IRanges::reduce()
#> ✖ dplyr::rename() masks S4Vectors::rename()
#> ✖ lubridate::second() masks S4Vectors::second()
#> ✖ lubridate::second<-() masks S4Vectors::second<-()
#> ✖ dplyr::slice() masks IRanges::slice()
#> ℹ Use the conflicted package (<http://conflicted.r-lib.org/>) to force all conflicts to become errors
df <- mtcars %>%
dplyr::select(cyl, vs, am, gear, carb) %>%
as.data.frame() %>%
dplyr::mutate(across(everything(), as.factor))
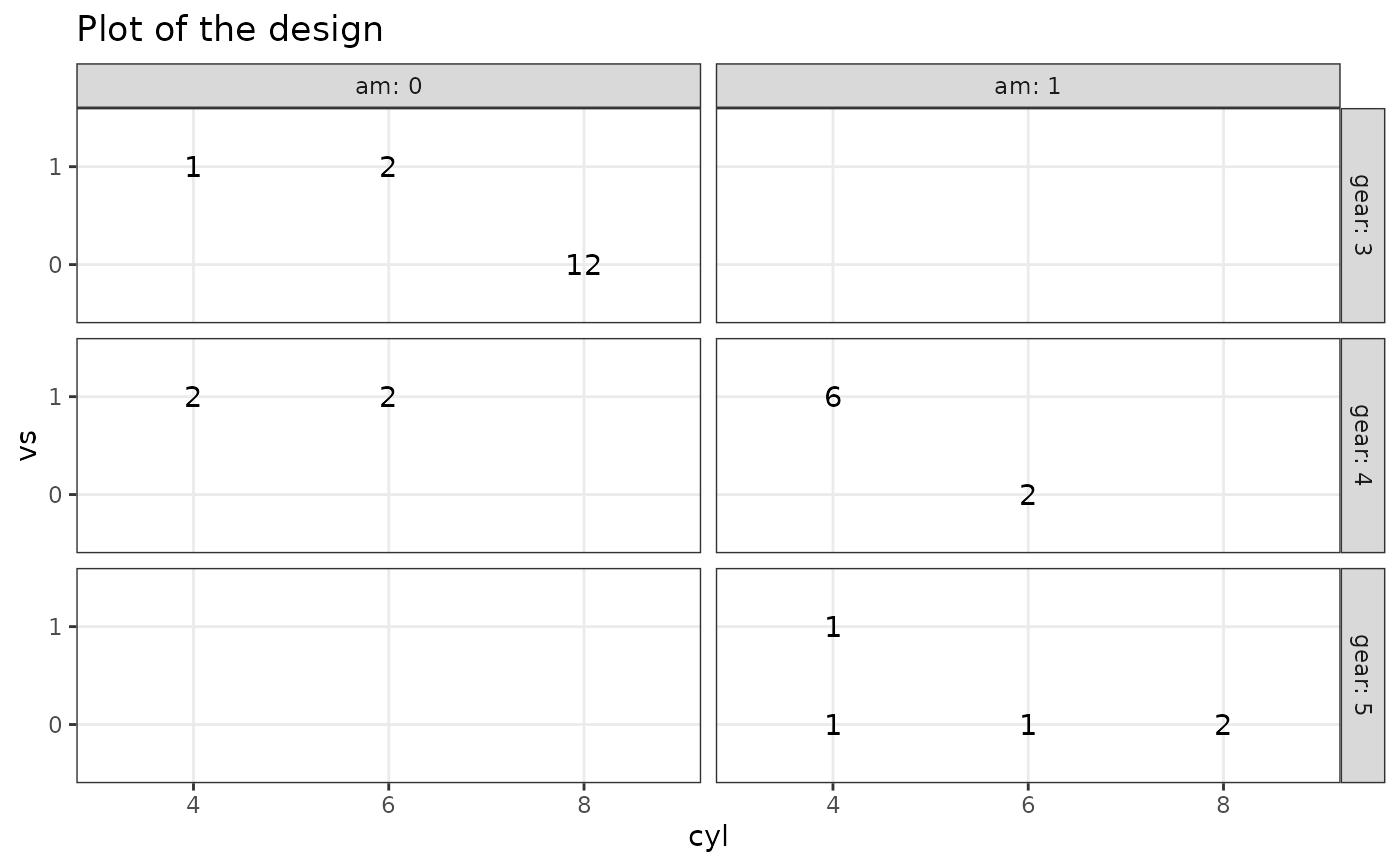
# Default behavior: display the 4 first factors in the design
plotDesign(design = df)
 # 2 factors
plotDesign(
design = df, x = "cyl", y = "vs",
cols = NULL, rows = NULL
)
 # 3 factors
plotDesign(
design = df, x = "cyl", y = "vs",
cols = NULL, rows = c("am")
)
 # 4 factors
plotDesign(
design = df, x = "cyl", y = "vs",
cols = c("gear"), rows = c("am")
)
 # 5 factors
plotDesign(
design = df, x = "cyl", y = "vs",
cols = c("gear"), rows = c("am", "carb")
)
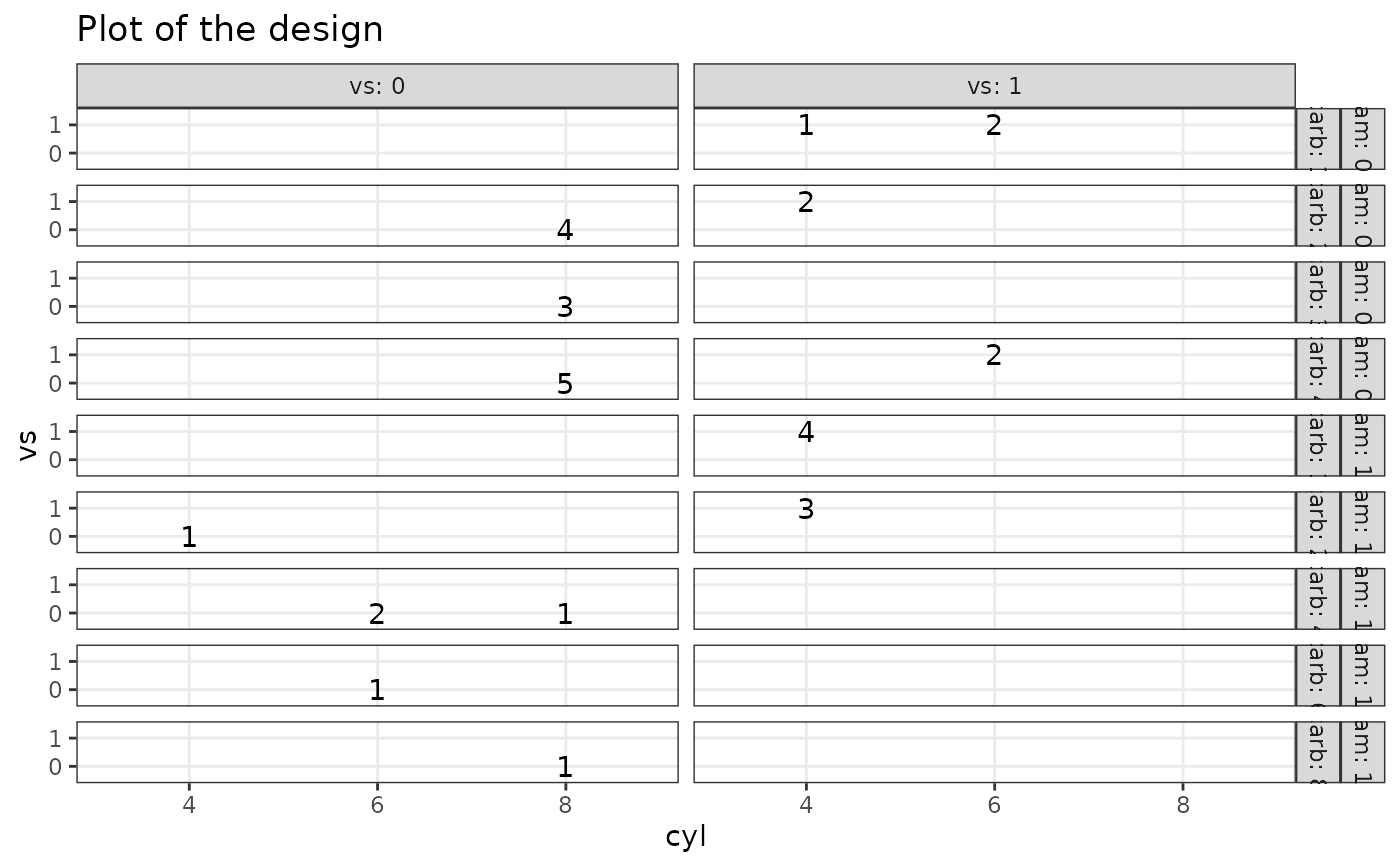
 plotDesign(
design = df, x = "cyl", y = "vs",
cols = c("vs"), rows = c("am", "carb")
)
 ### UCH
data("UCH")
plotDesign(design = UCH$design, x = "Hippurate", y = "Citrate", rows = "Day")
