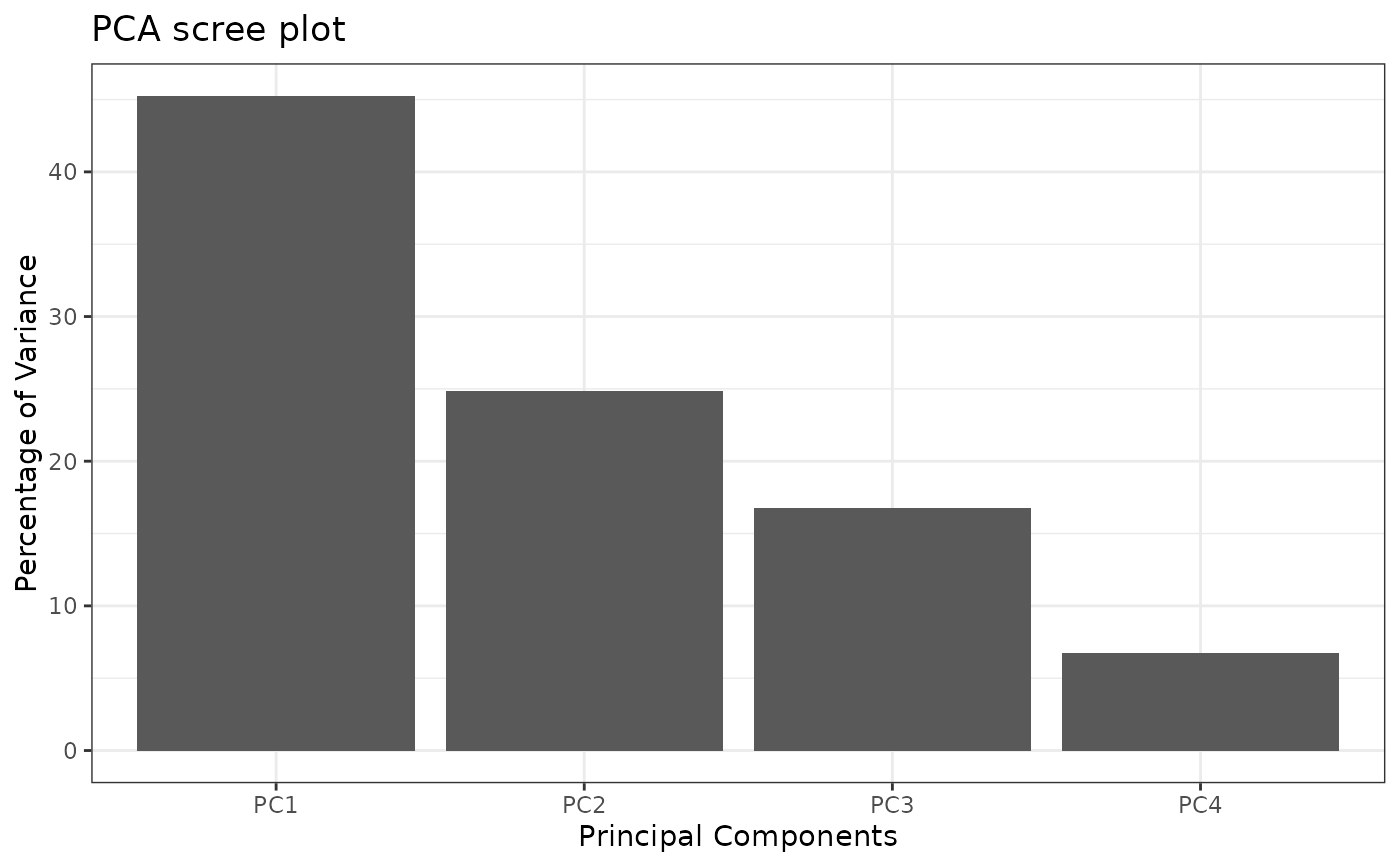
Returns a bar plot of the percentage of variance explained by each Principal Component calculated by pcaBySvd.
Arguments
- resPcaBySvd
A list corresponding to the output value of
pcaBySvd.- nPC
An integer with the number of Principal Components to plot.
- title
Plot title.
- theme
ggplot2theme, see?ggthemefor more info.