Plots the loading vectors from pcaBySvd output with different available line types.
Usage
pcaLoading1dPlot(resPcaBySvd, axes = c(1, 2), title = "PCA loading plot", ...)
Arguments
- resPcaBySvd
A list corresponding to the output value of pcaBySvd.
- axes
A numerical vector of length 2 with the Principal Components axes to be drawn.
- title
Plot title.
- ...
Additional arguments to be passed to plotLine.
Value
A ggplot2 object with the PCA loading plot.
Details
pcaLoading1dPlot is a wrapper of plotLine. See ?plotLine for more information on the additional arguments.
Examples
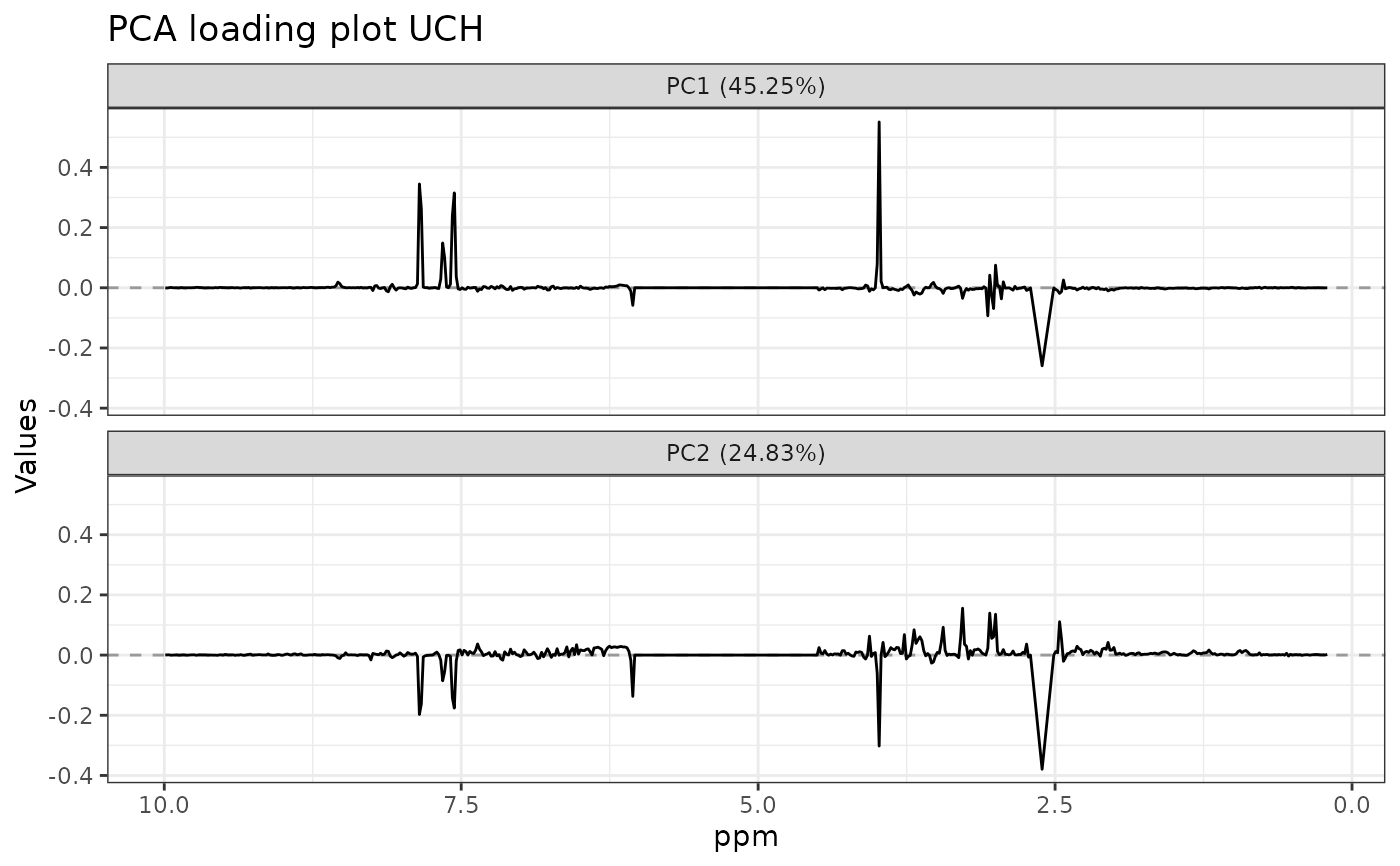
data("UCH")
ResPCA <- pcaBySvd(UCH$outcomes)

pcaLoading1dPlot(
  resPcaBySvd = ResPCA, axes = c(1, 2),
  title = "PCA loading plot UCH", xlab = "ppm", ylab = "Values"
)